Team reviewing preventive maintenance analytics and equipment reliability dashboards in a food manufacturing facility
Process Improvement

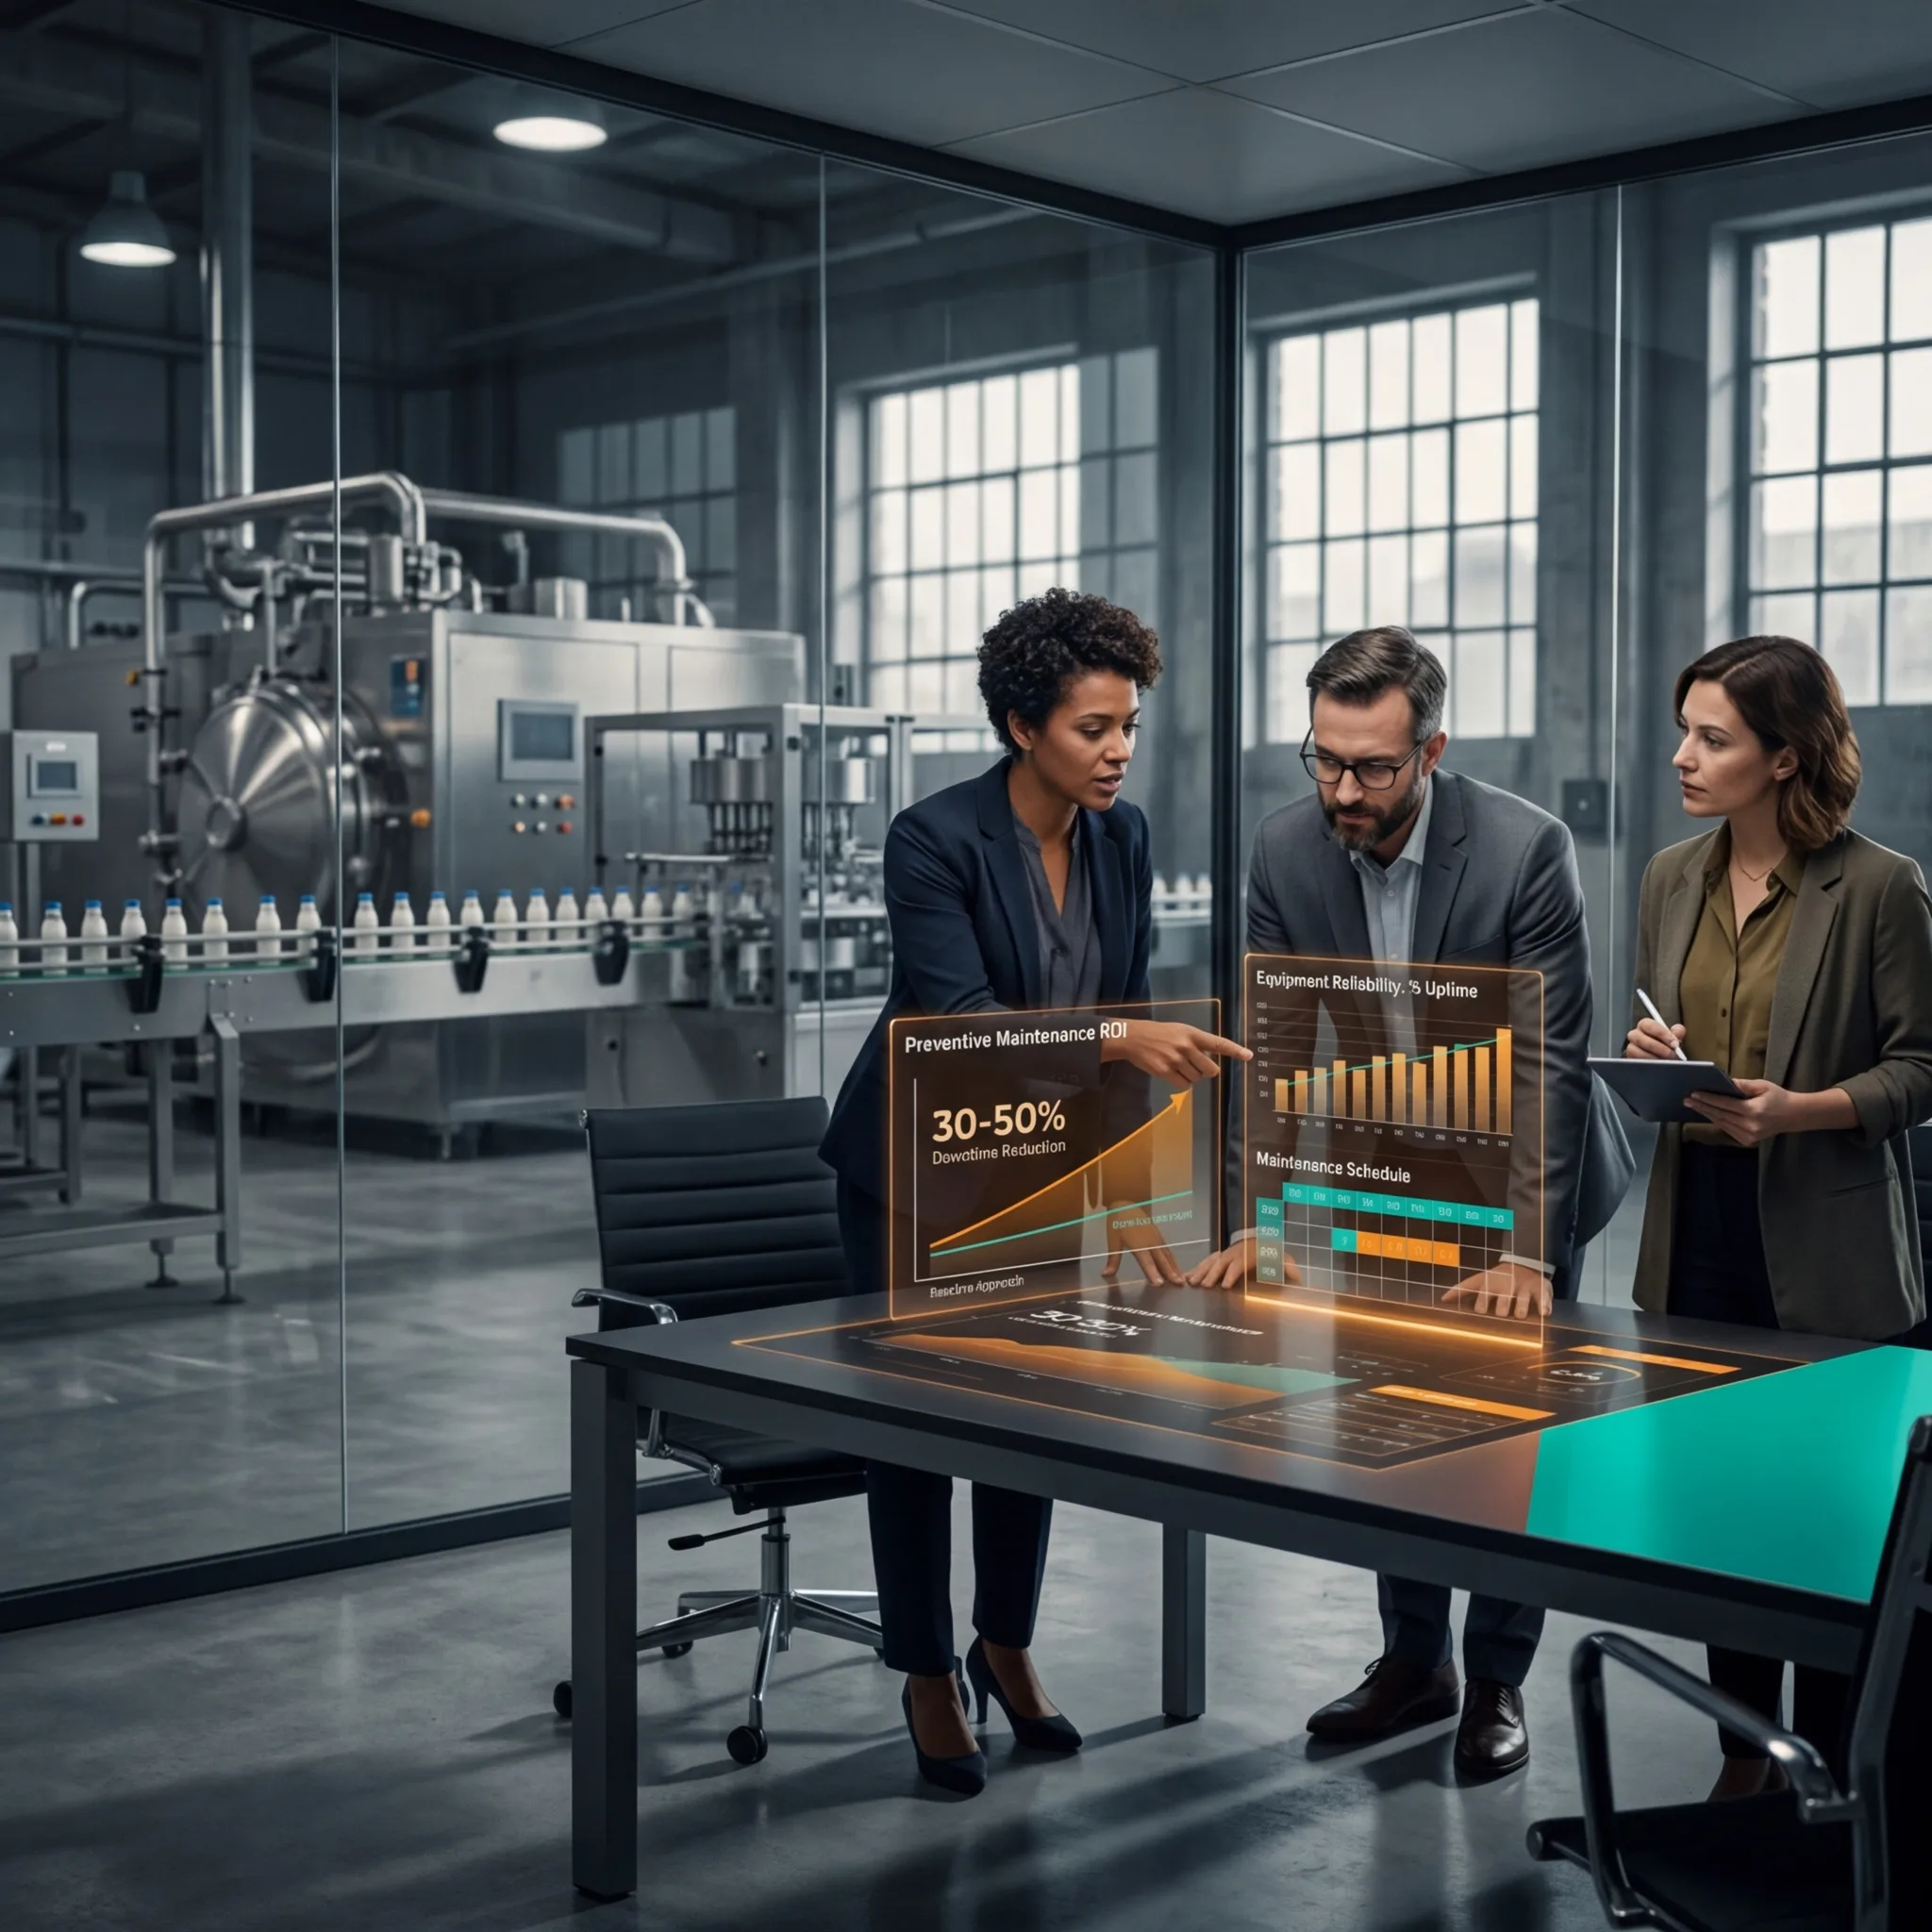
Maintenance Strategy and Equipment Reliability: Preventive vs. Reactive

Reactive maintenance looks cheaper on paper but costs $3.9M more annually in downtime. Here's the preventive approach that delivers 400% ROI.

3 min read
Process engineer inspecting an open ribbon mixer blending colorful spice powders in a food manufacturing facility with holographic displays showing residence time distribution and coefficient of variation data
Process Improvement

Mixing and Blending Equipment: Design and Selection

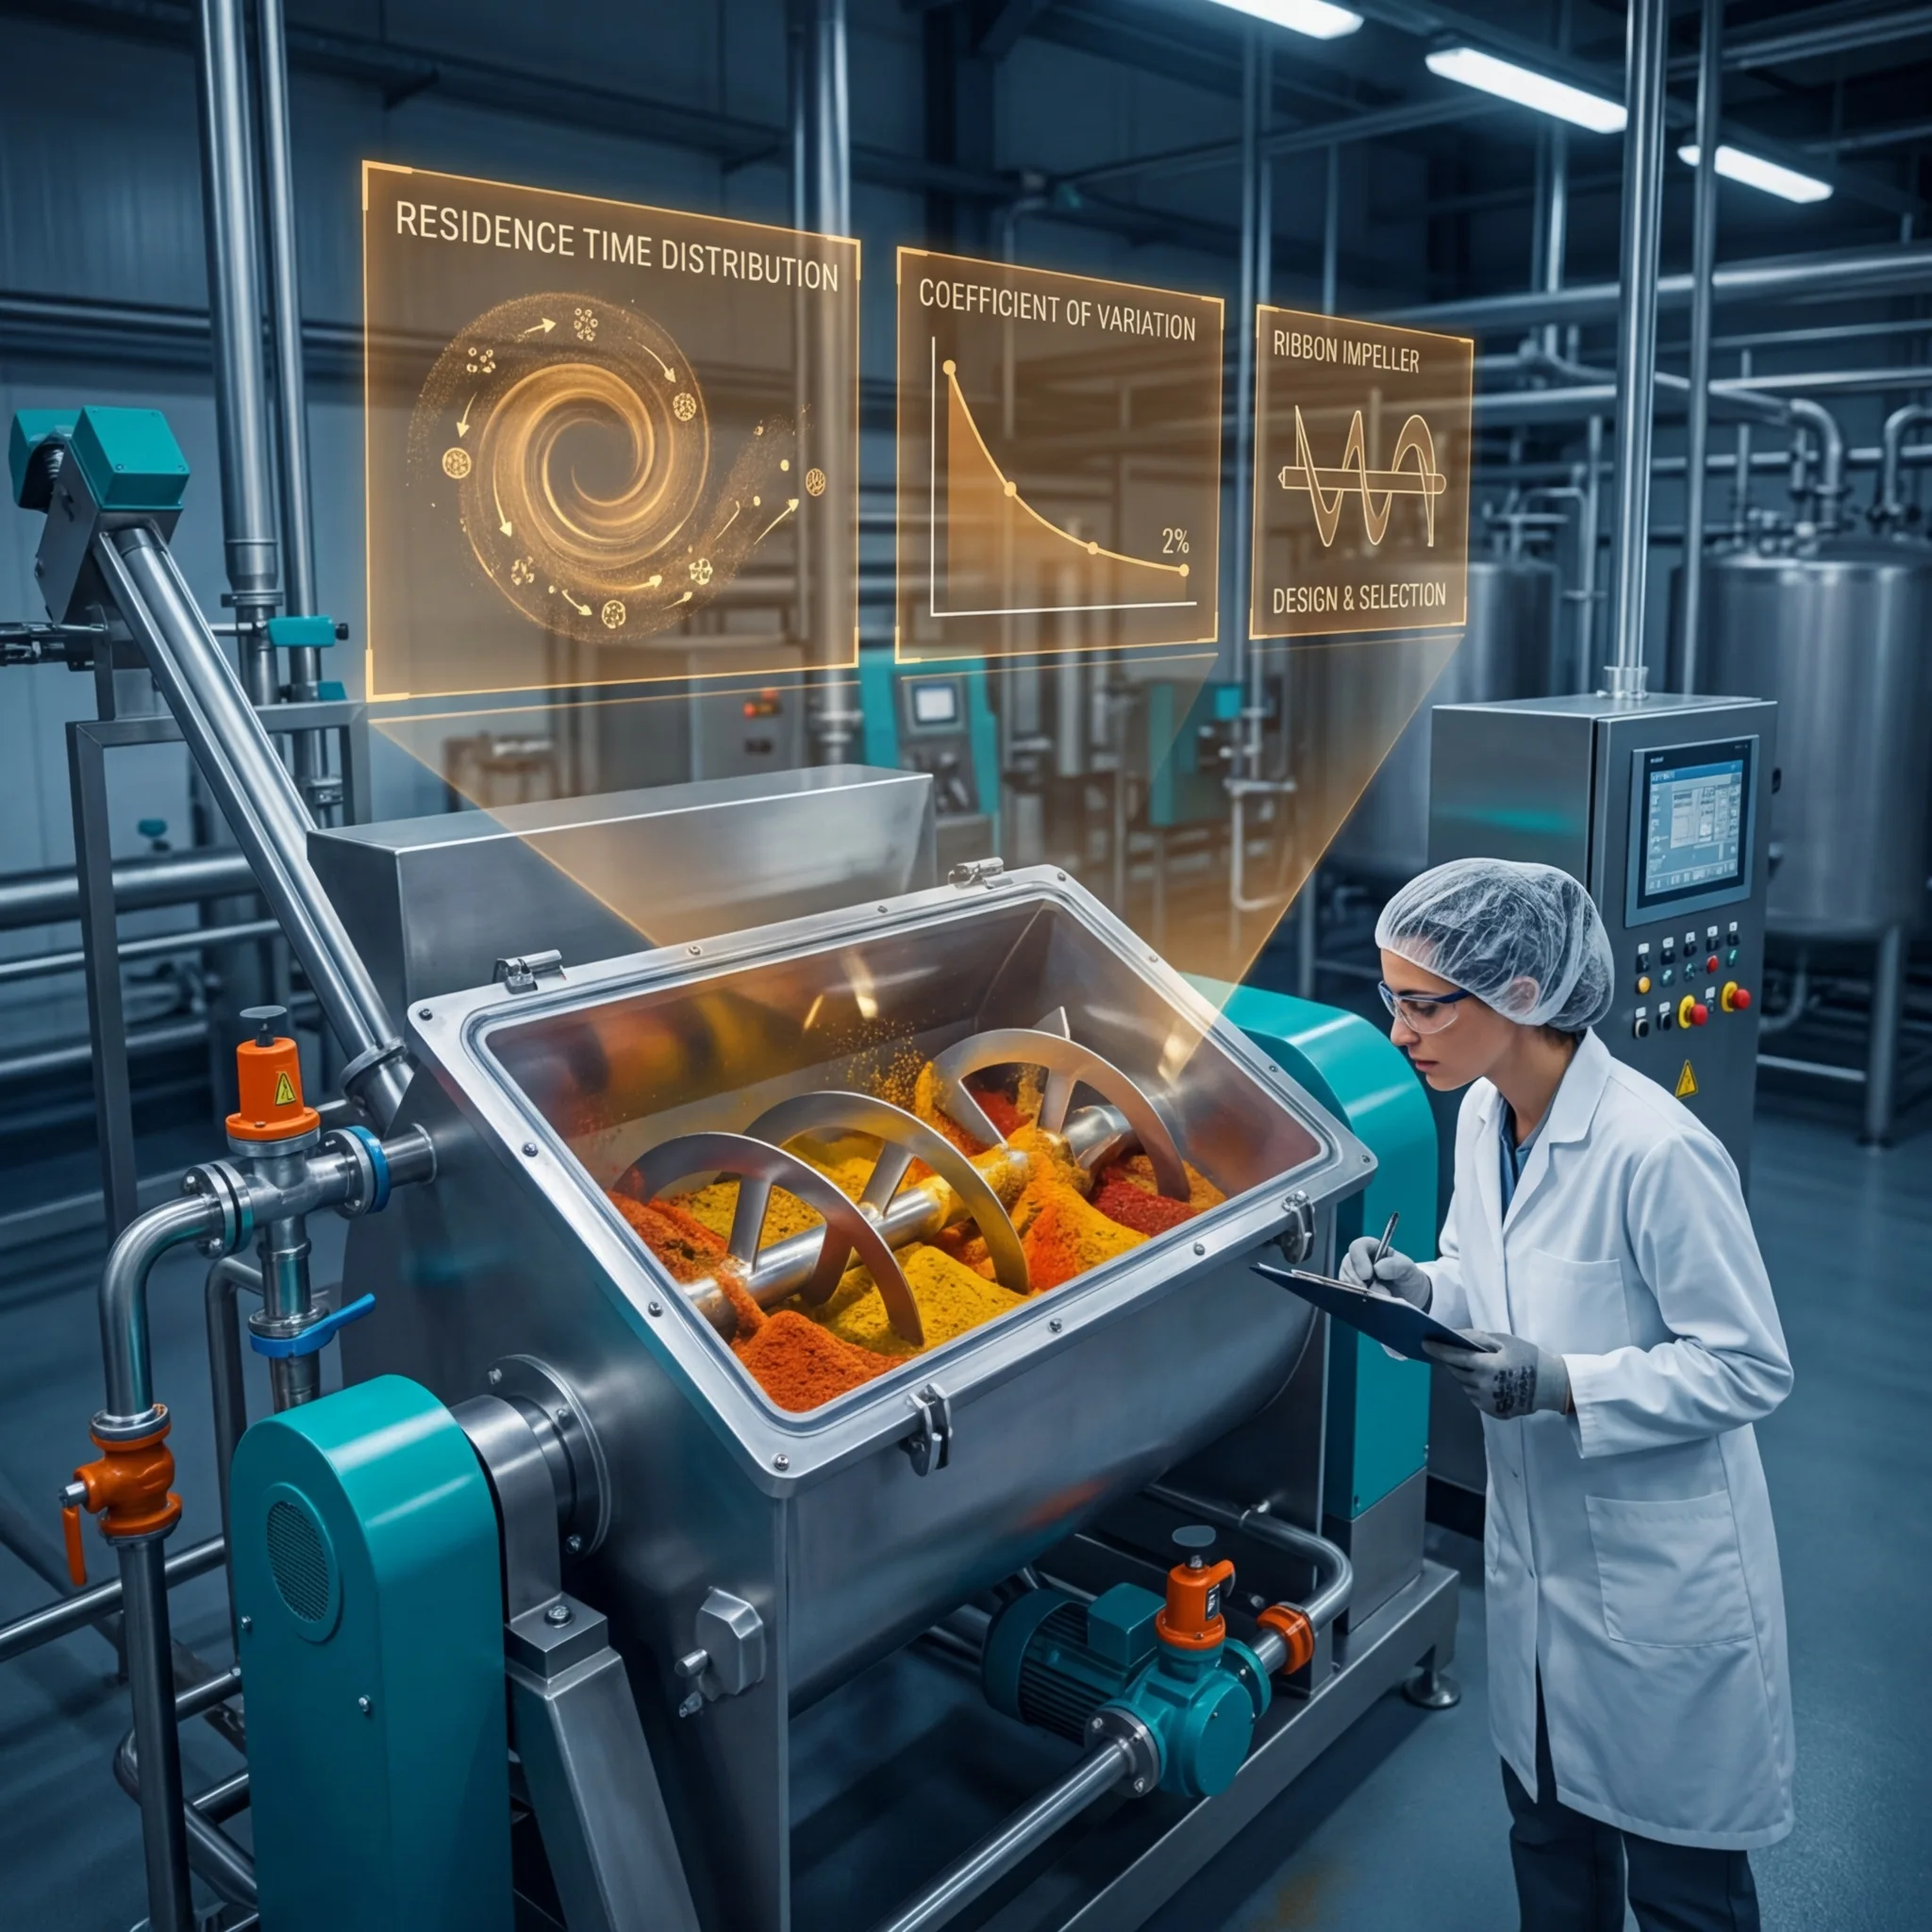
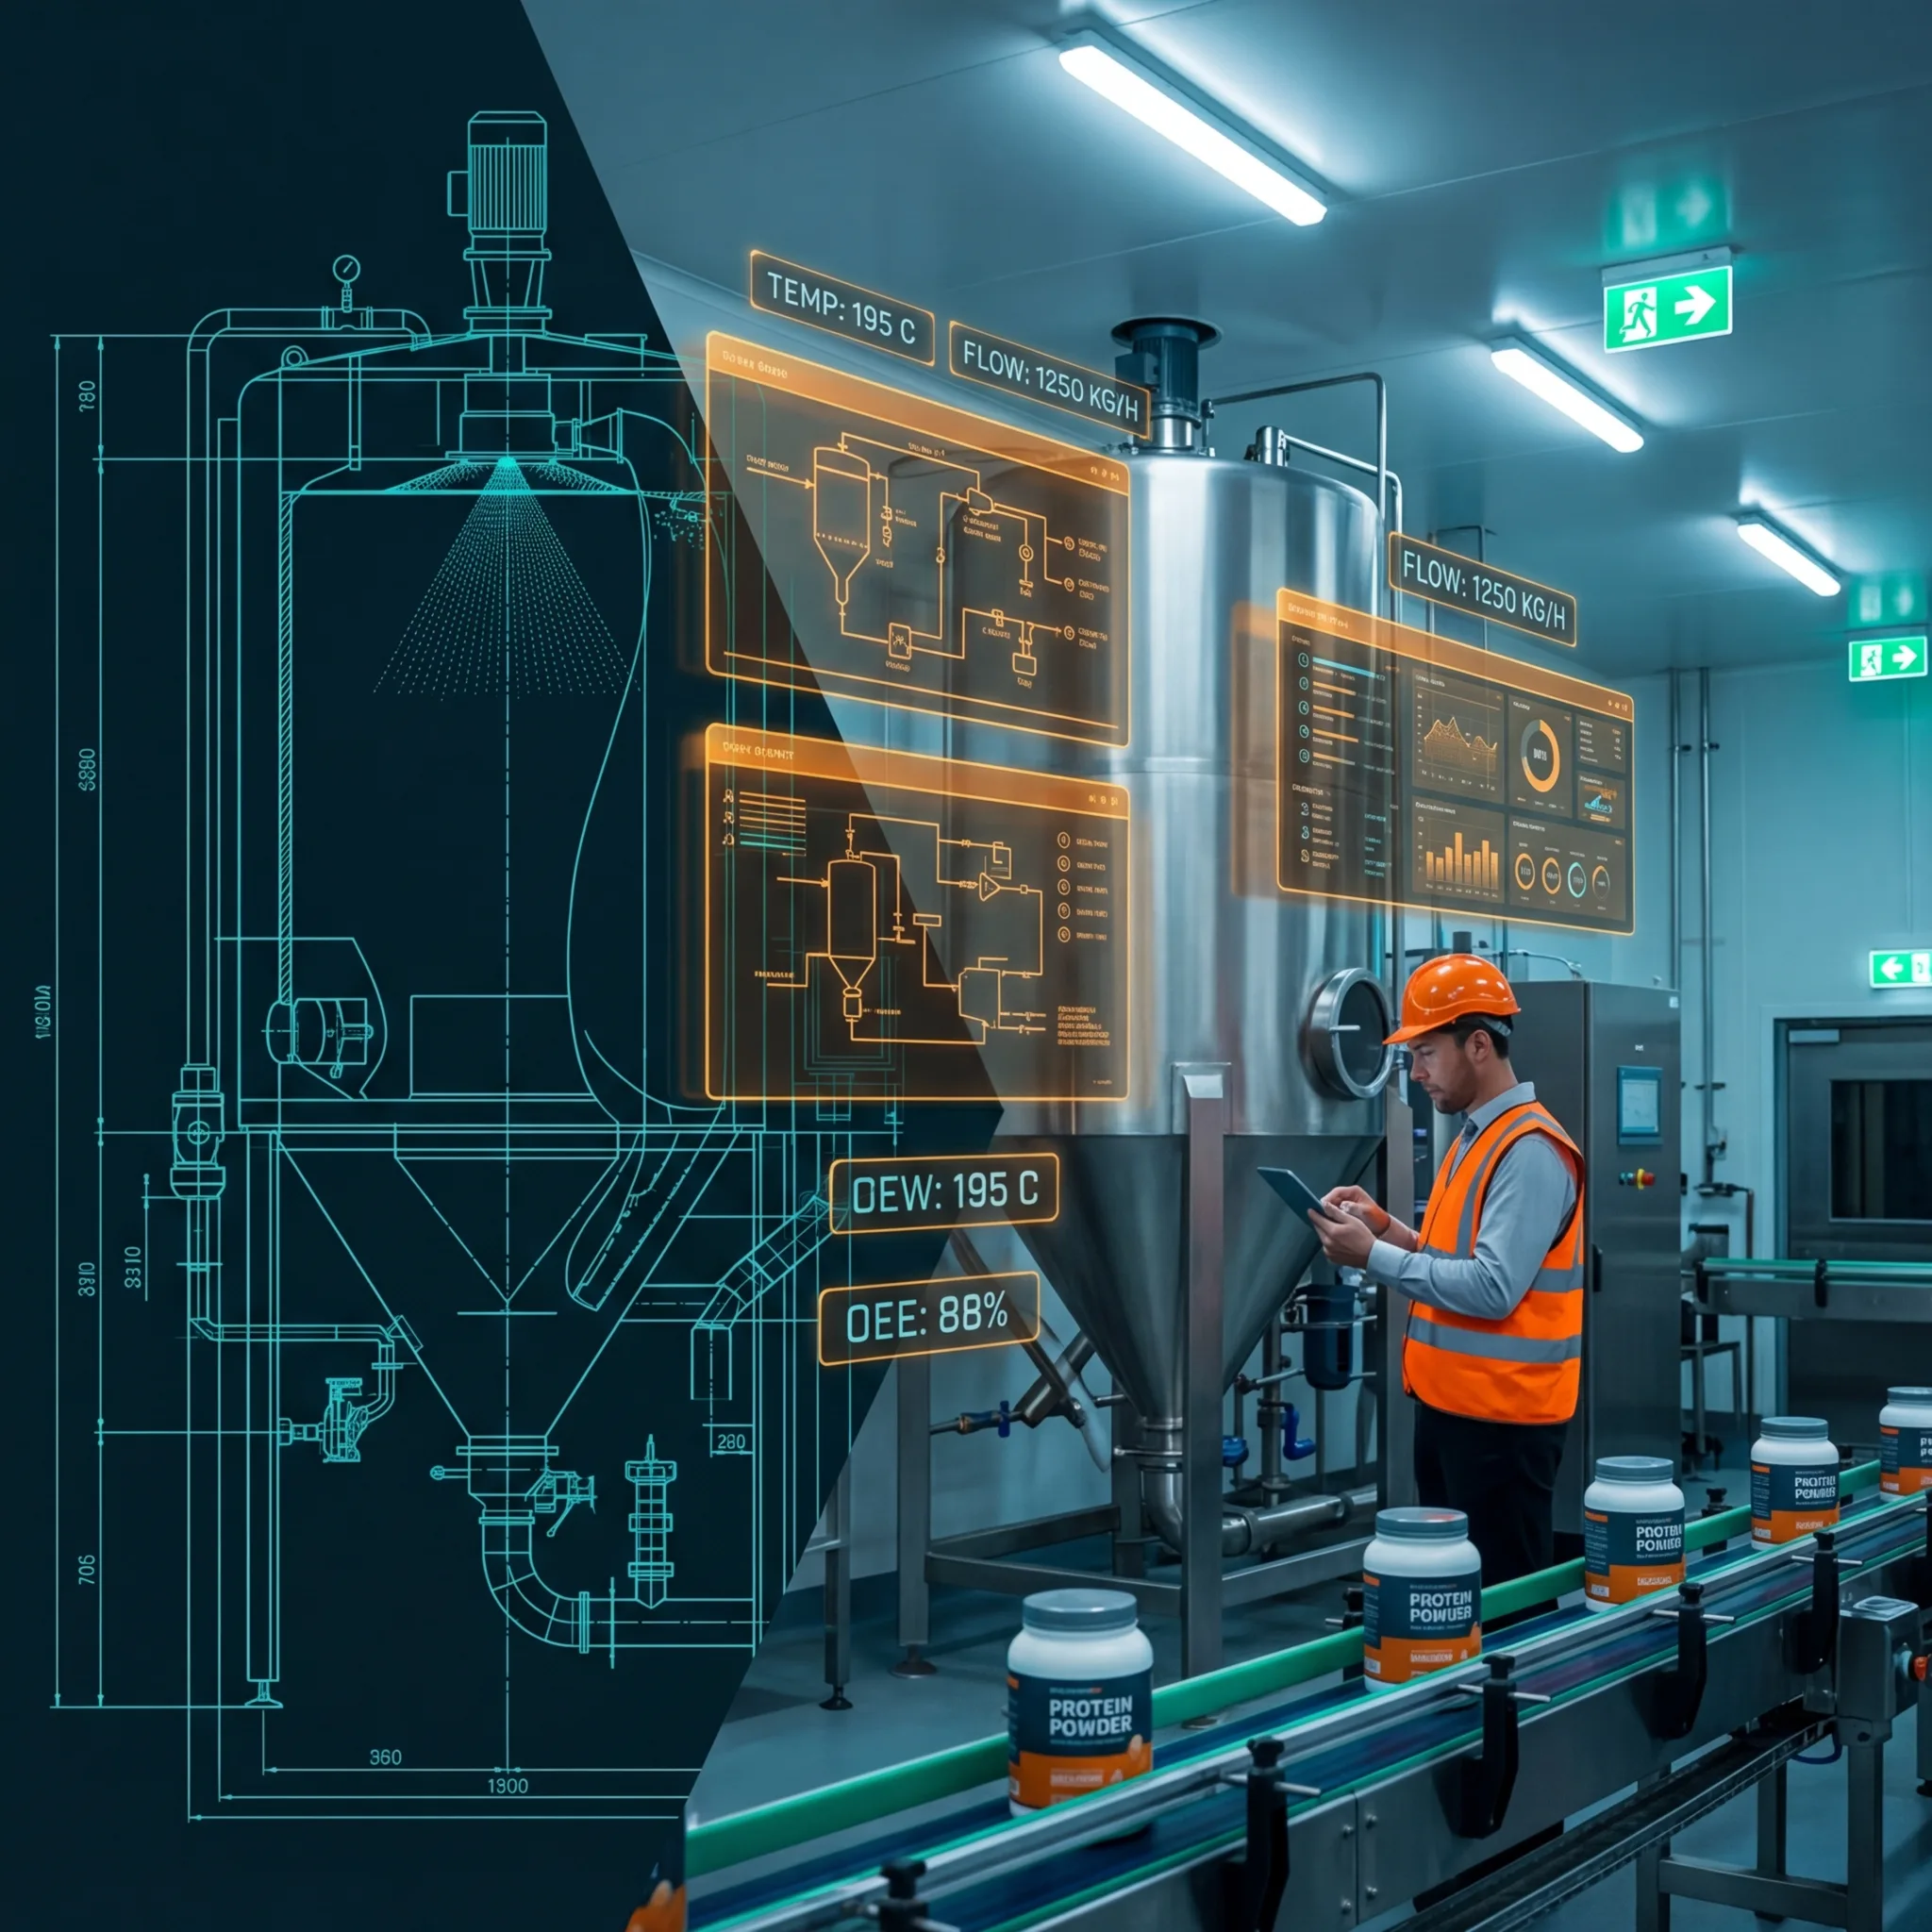
Mixer selection directly impacts product quality, consistency, and shelf-life. Here's the engineering framework for choosing and optimizing mixing equipment.

4 min read
Split view of equipment blueprint analysis and engineer monitoring OEE metrics on a bottling production line
Process Improvement

The OEE Improvement Roadmap: From Measurement to Action

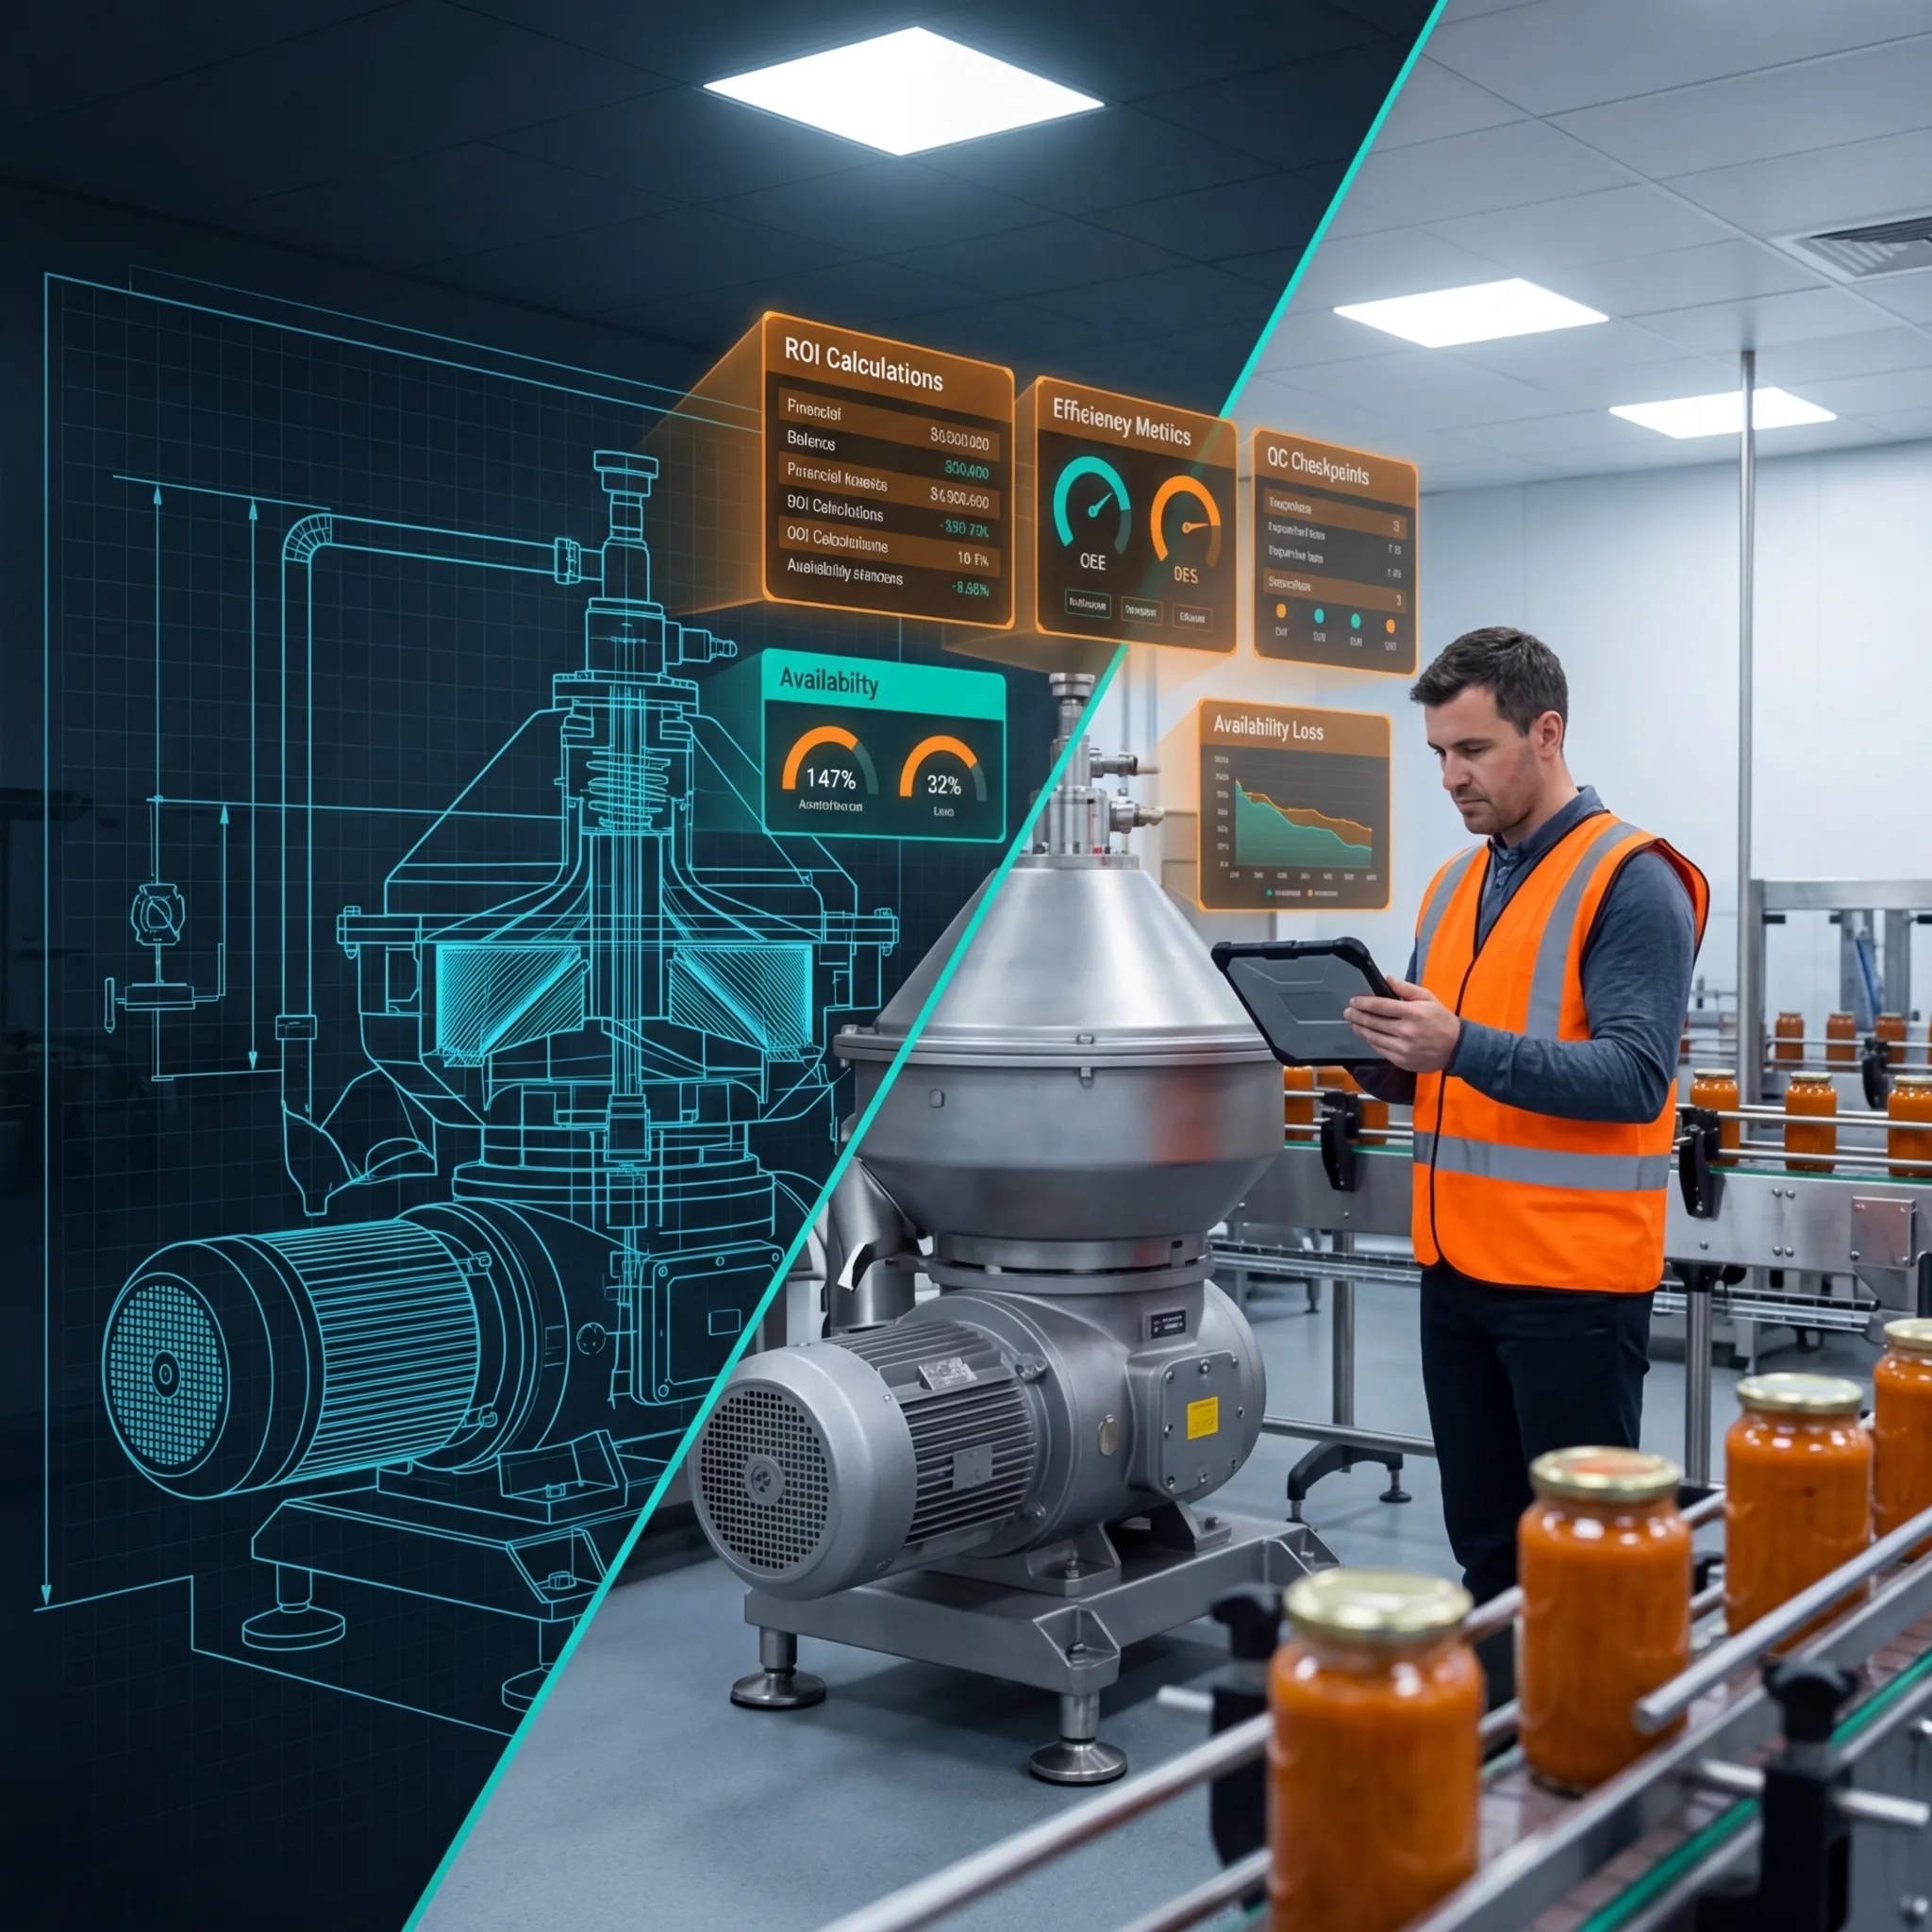
Your OEE is 68%. Which component do you fix first? Pareto analysis reveals where capital and focus deliver maximum return per dollar invested.

3 min read
CFO reviewing SG&A cost structure and profitability comparison displays overlooking a food production floor
Capital Planning

Operating Expense Management: Controlling SG&A and Overhead Costs

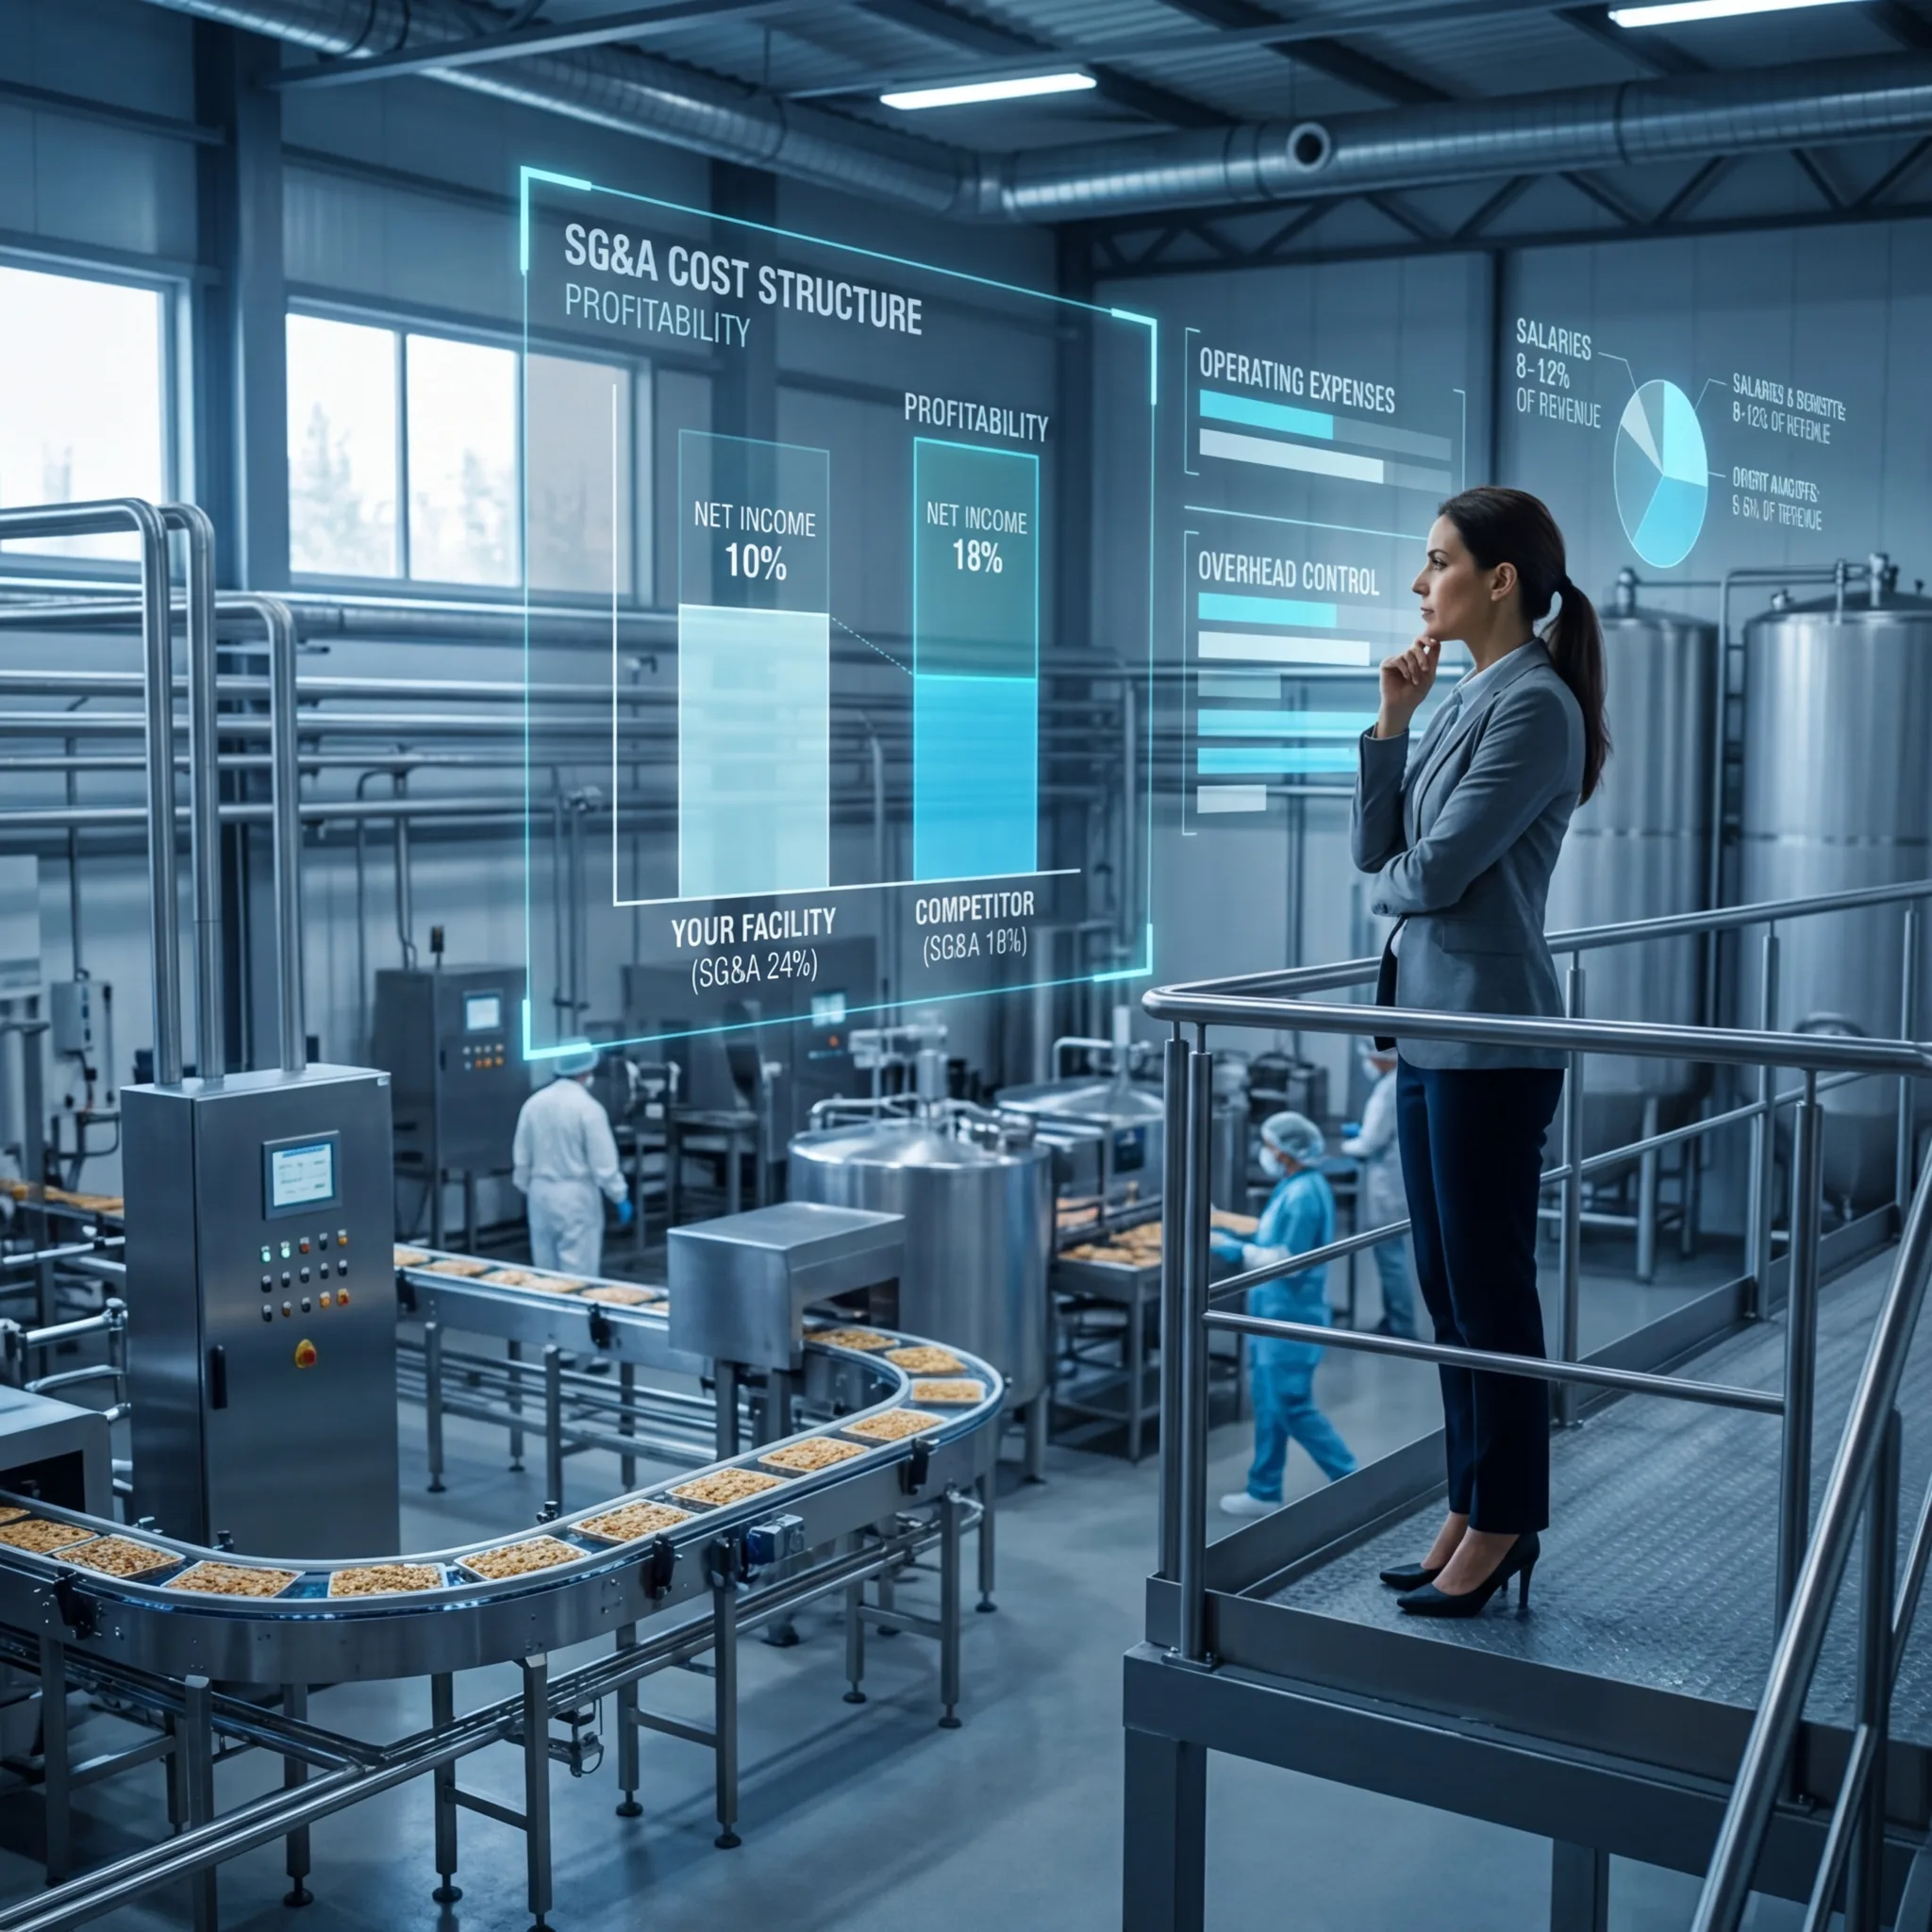
Same revenue, same COGS, but $4M difference in profitability. The gap: SG&A cost control. Here's the benchmarking framework that identifies $2.45M in potential improvement.

3 min read
Split view of engineering blueprint and operator monitoring real-time dashboard displays on a bottling line
Process Improvement

Operational Dashboards and Real-Time Reporting: Data-Driven Decision Making

Monthly reports are too late and too aggregated. Real-time dashboards identify problems in minutes vs. hours, delivering $450K-$1M in annual benefit.

3 min read
Overhead view of a synchronized dairy packaging line with engineers monitoring holographic line harmonization displays showing throughput integration across weighing, filling, labeling, and case packing stations
Process Improvement

Packaging Line Integration: Equipment Selection and Process Flow

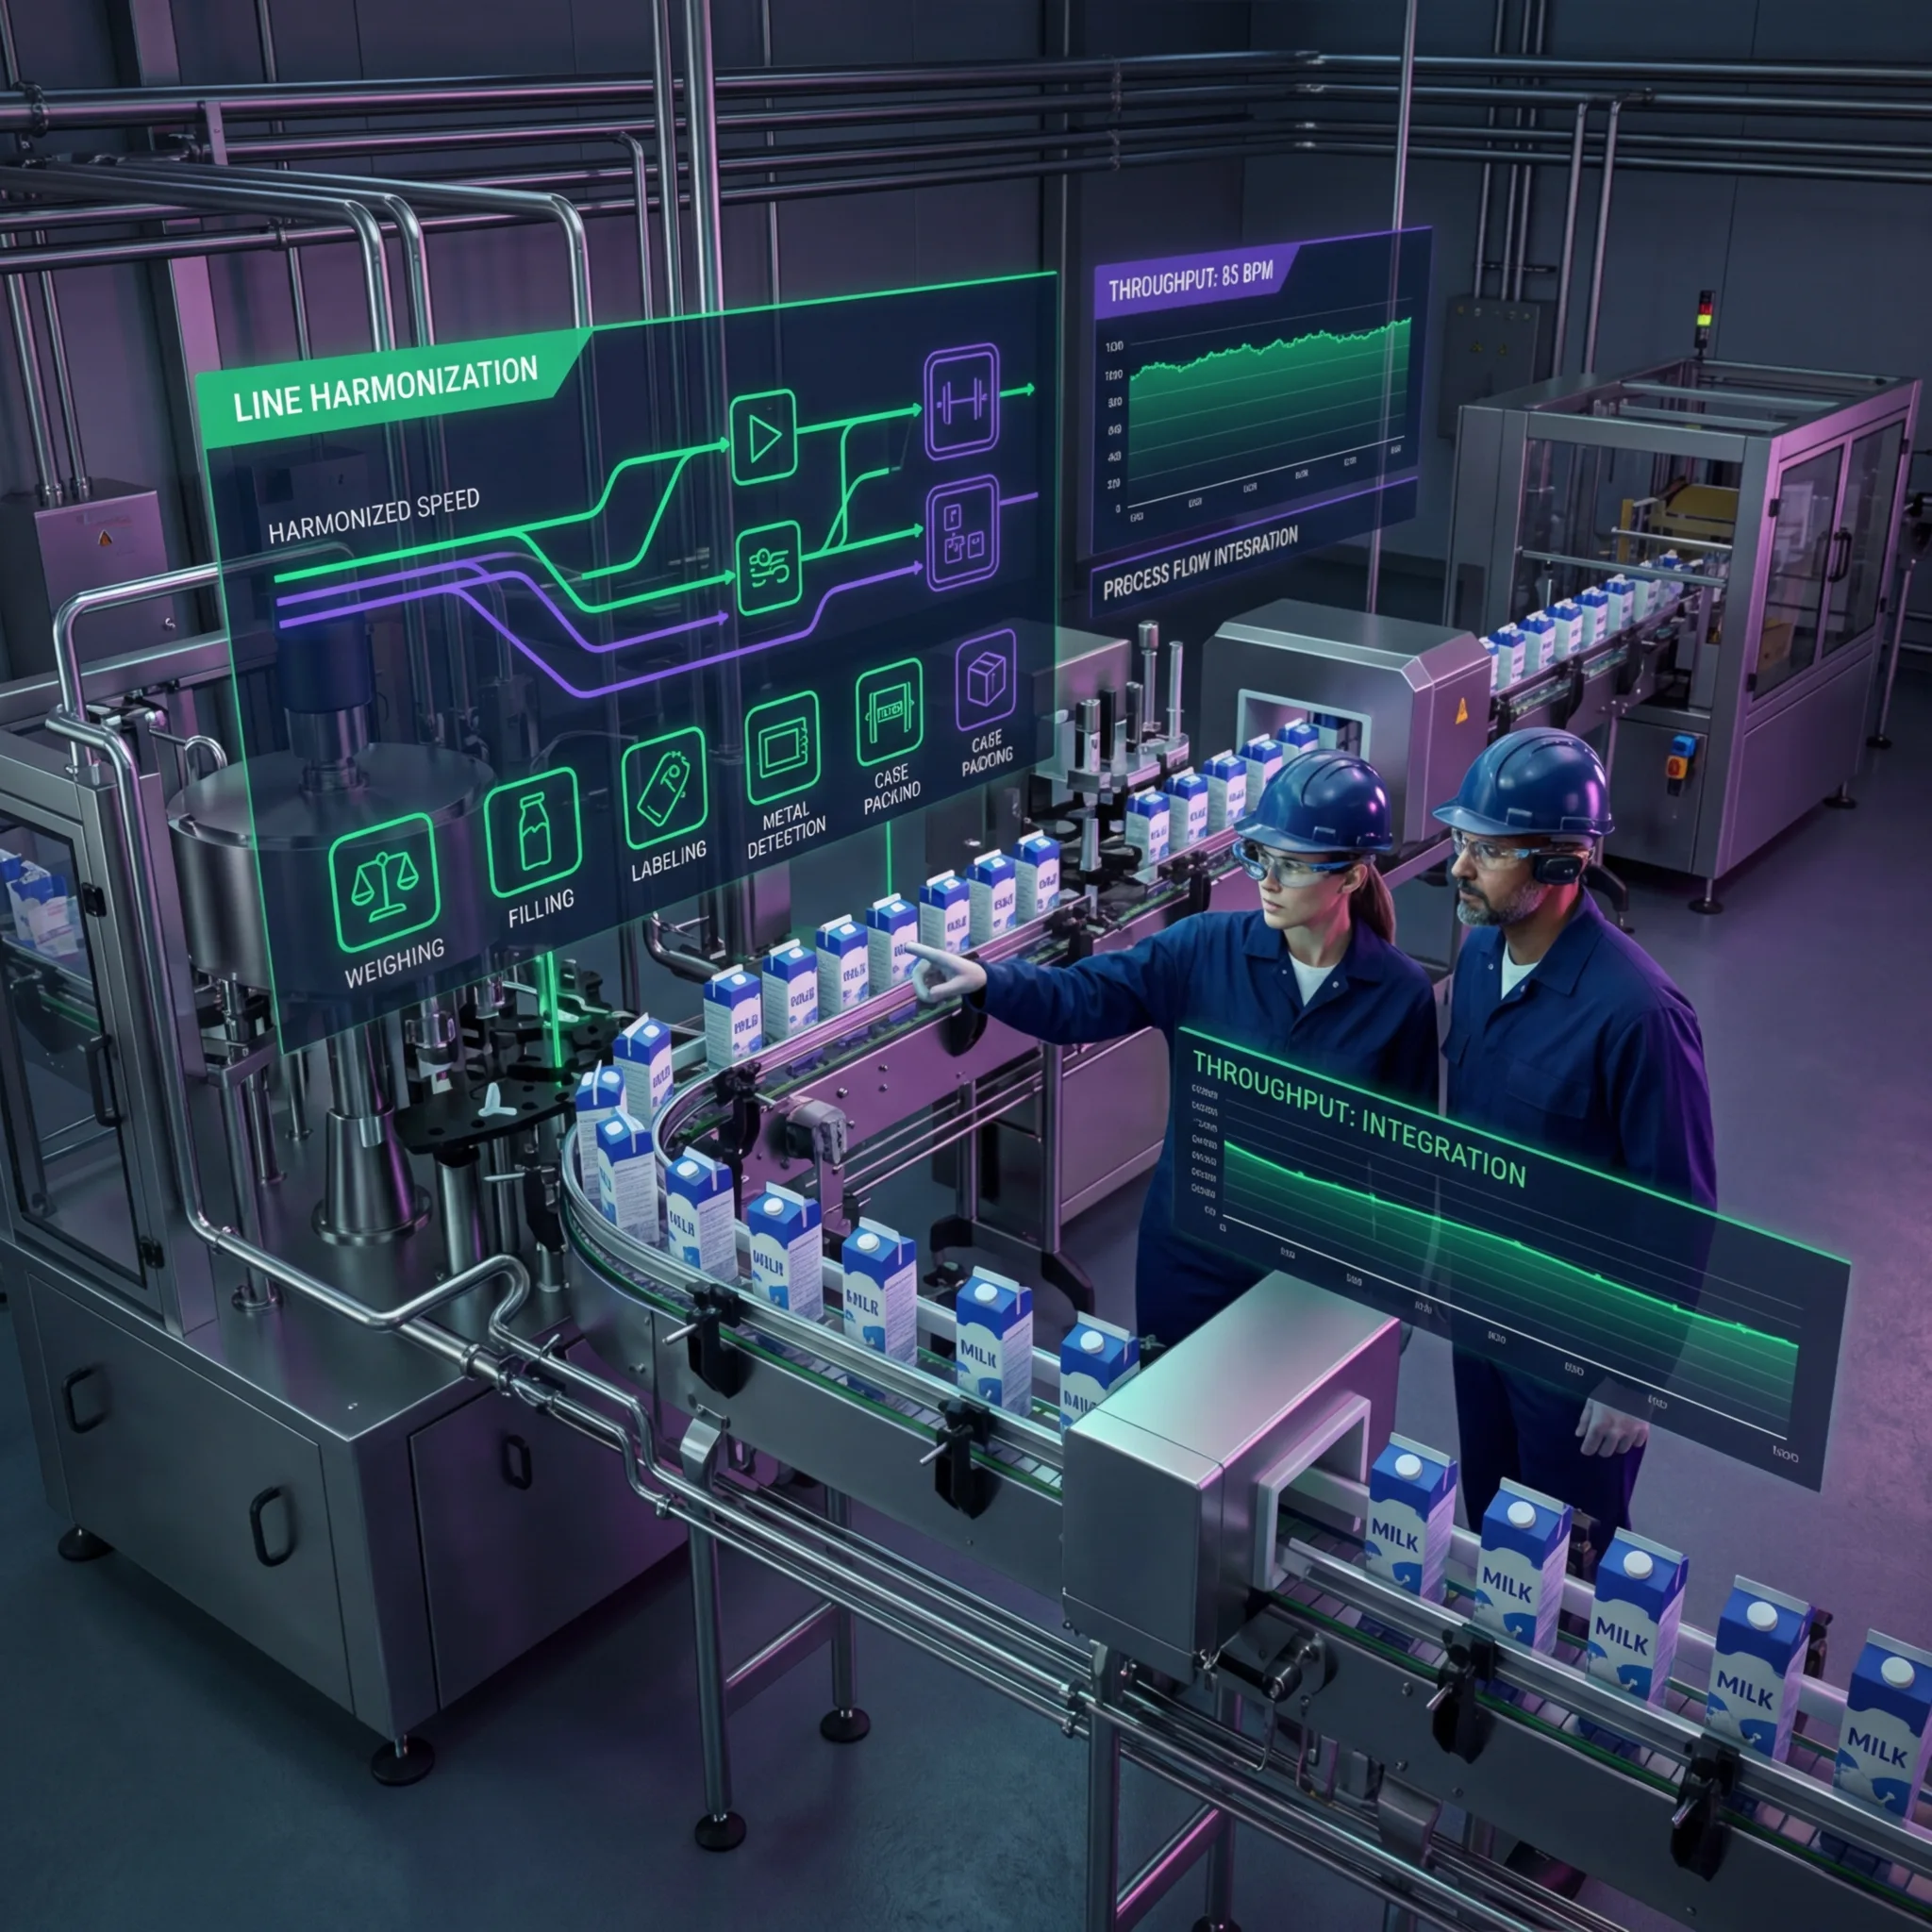
Speed mismatches cause bottlenecks and waste. Here's the engineering framework for designing synchronized packaging lines that maximize throughput and efficiency.

4 min read
Industrial abrasive peeling machine processing potatoes on a conveyor line with holographic displays showing yield optimization and waste reduction metrics
Process Improvement

Peeling and De-skinning Equipment: Mechanical and Chemical

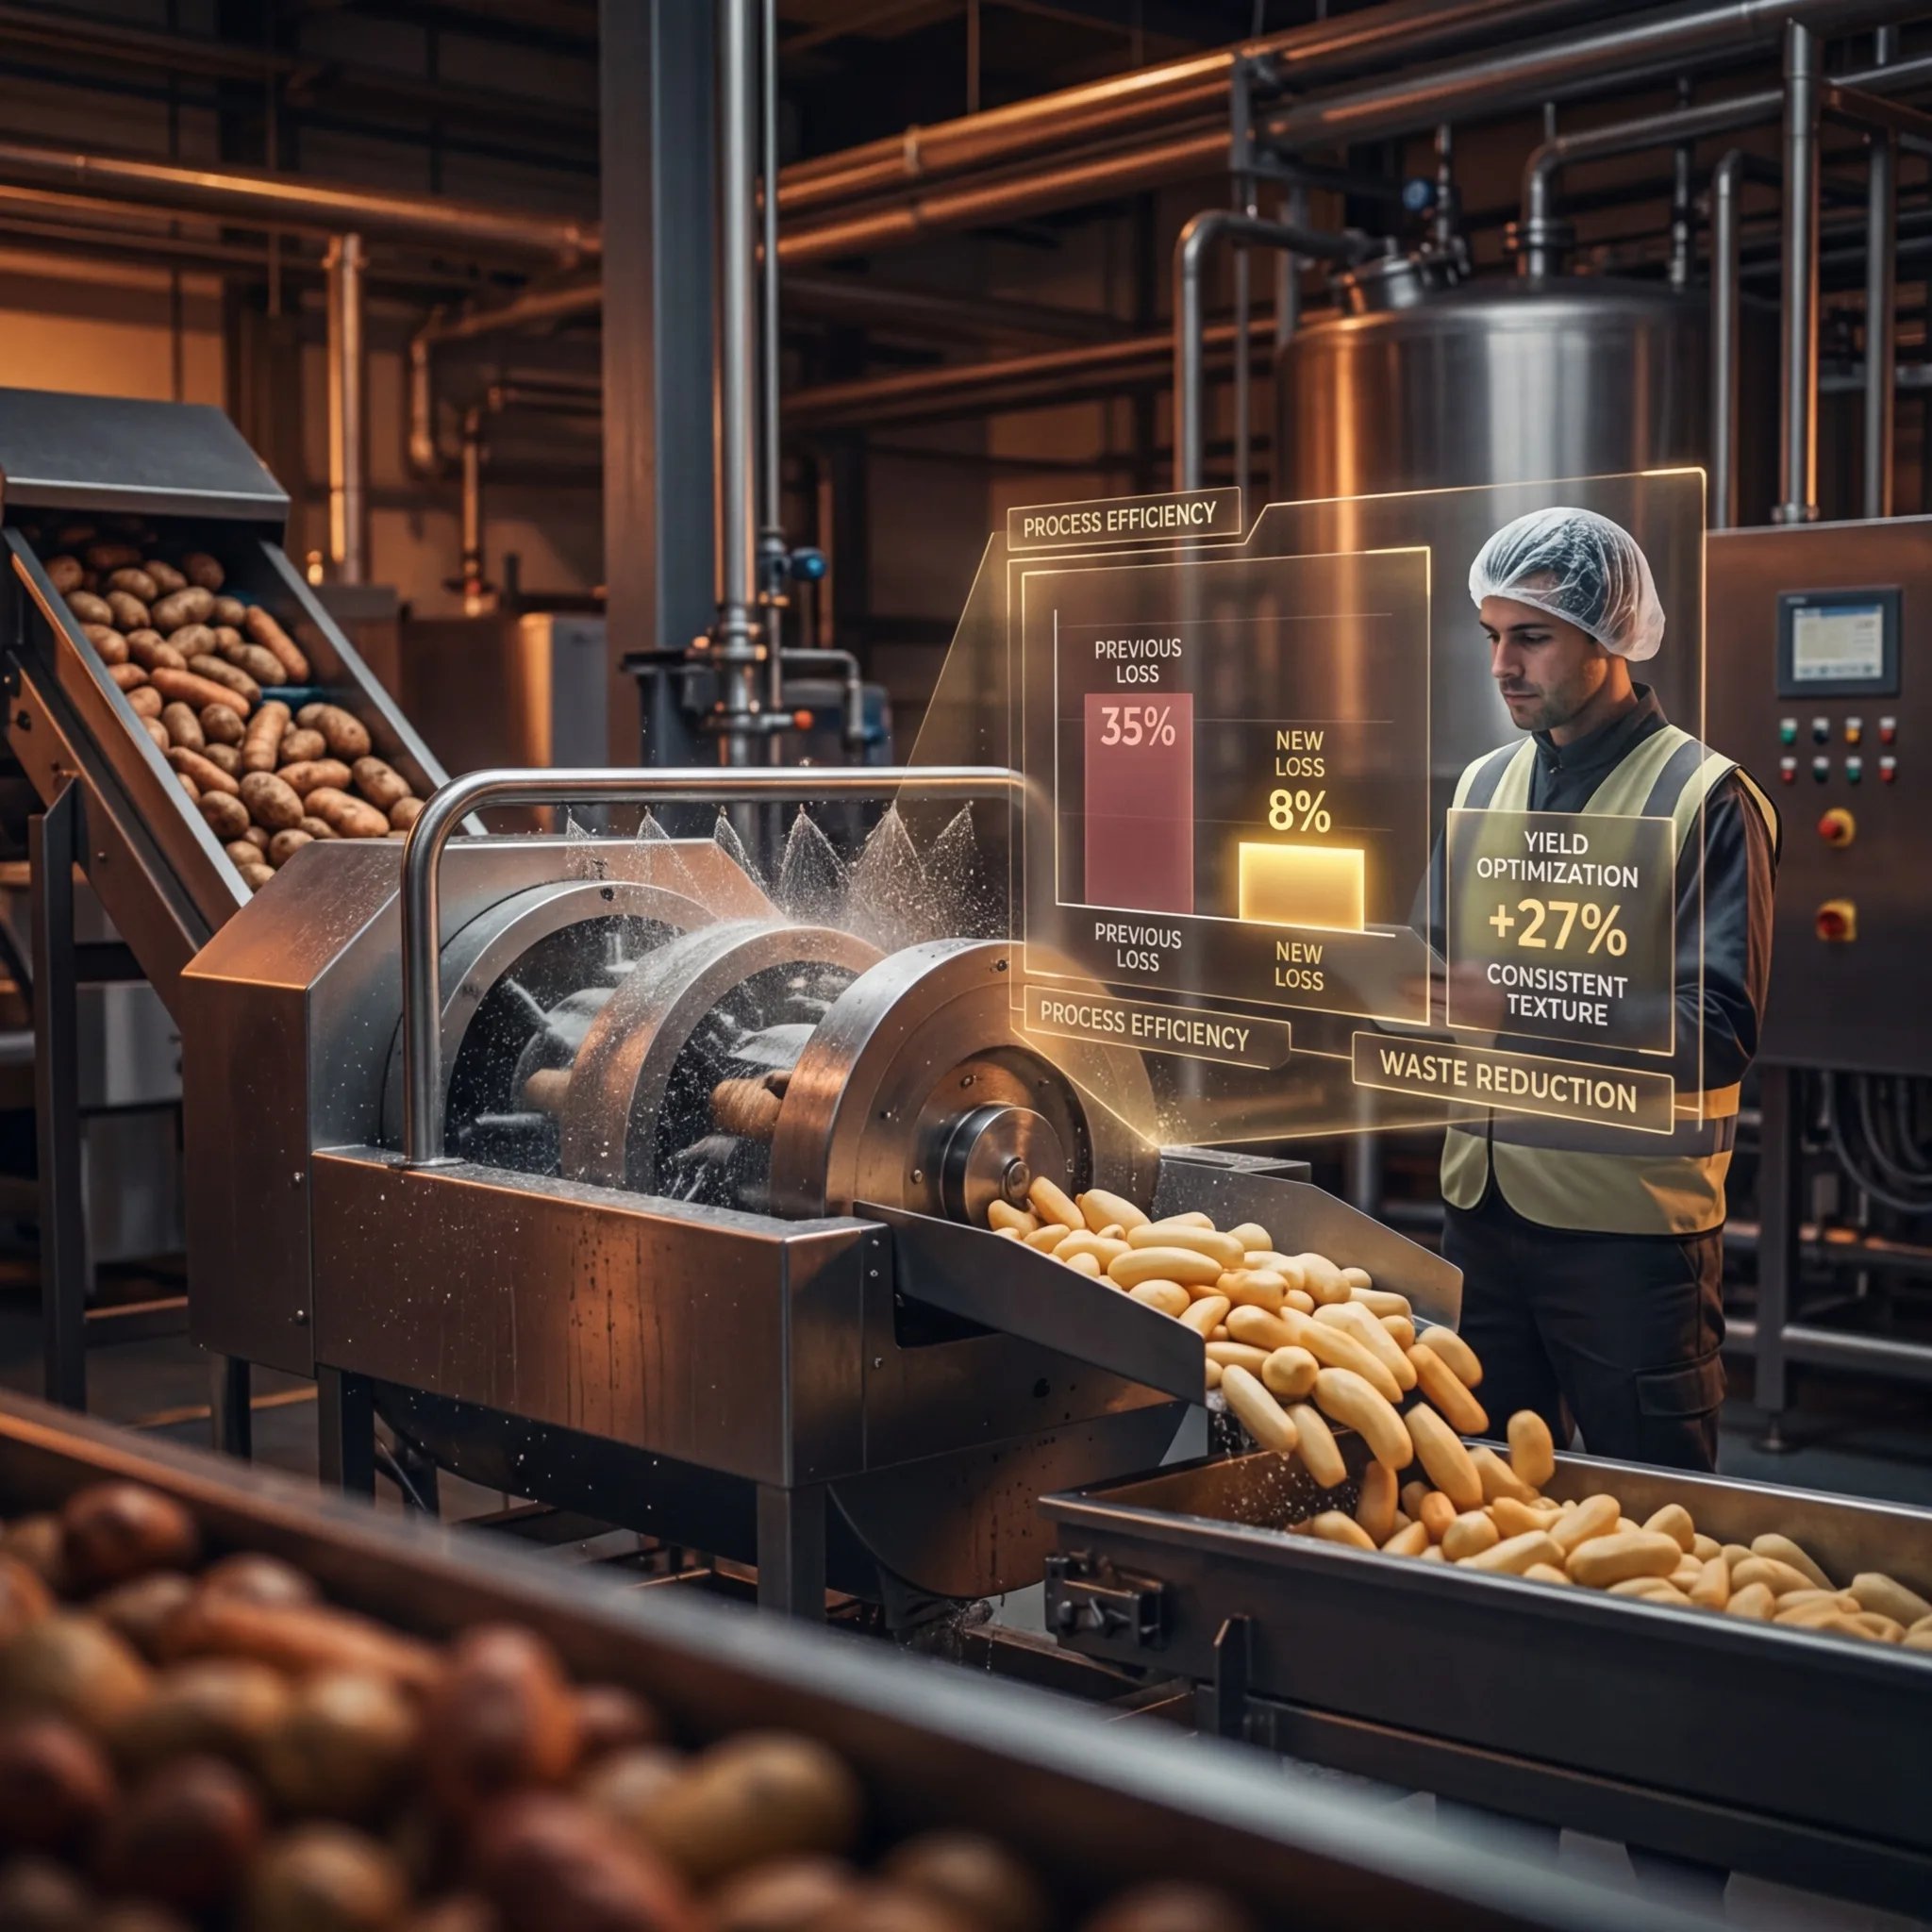
Peeling equipment selection directly impacts product yield and operational efficiency, with modern systems reducing material loss from 35% to under 8%.

4 min read
Plant manager reviewing performance gap dashboard showing OEE targets and accountability framework
Process Improvement

Performance Improvement Plans for Process and Personnel: Driving Accountability

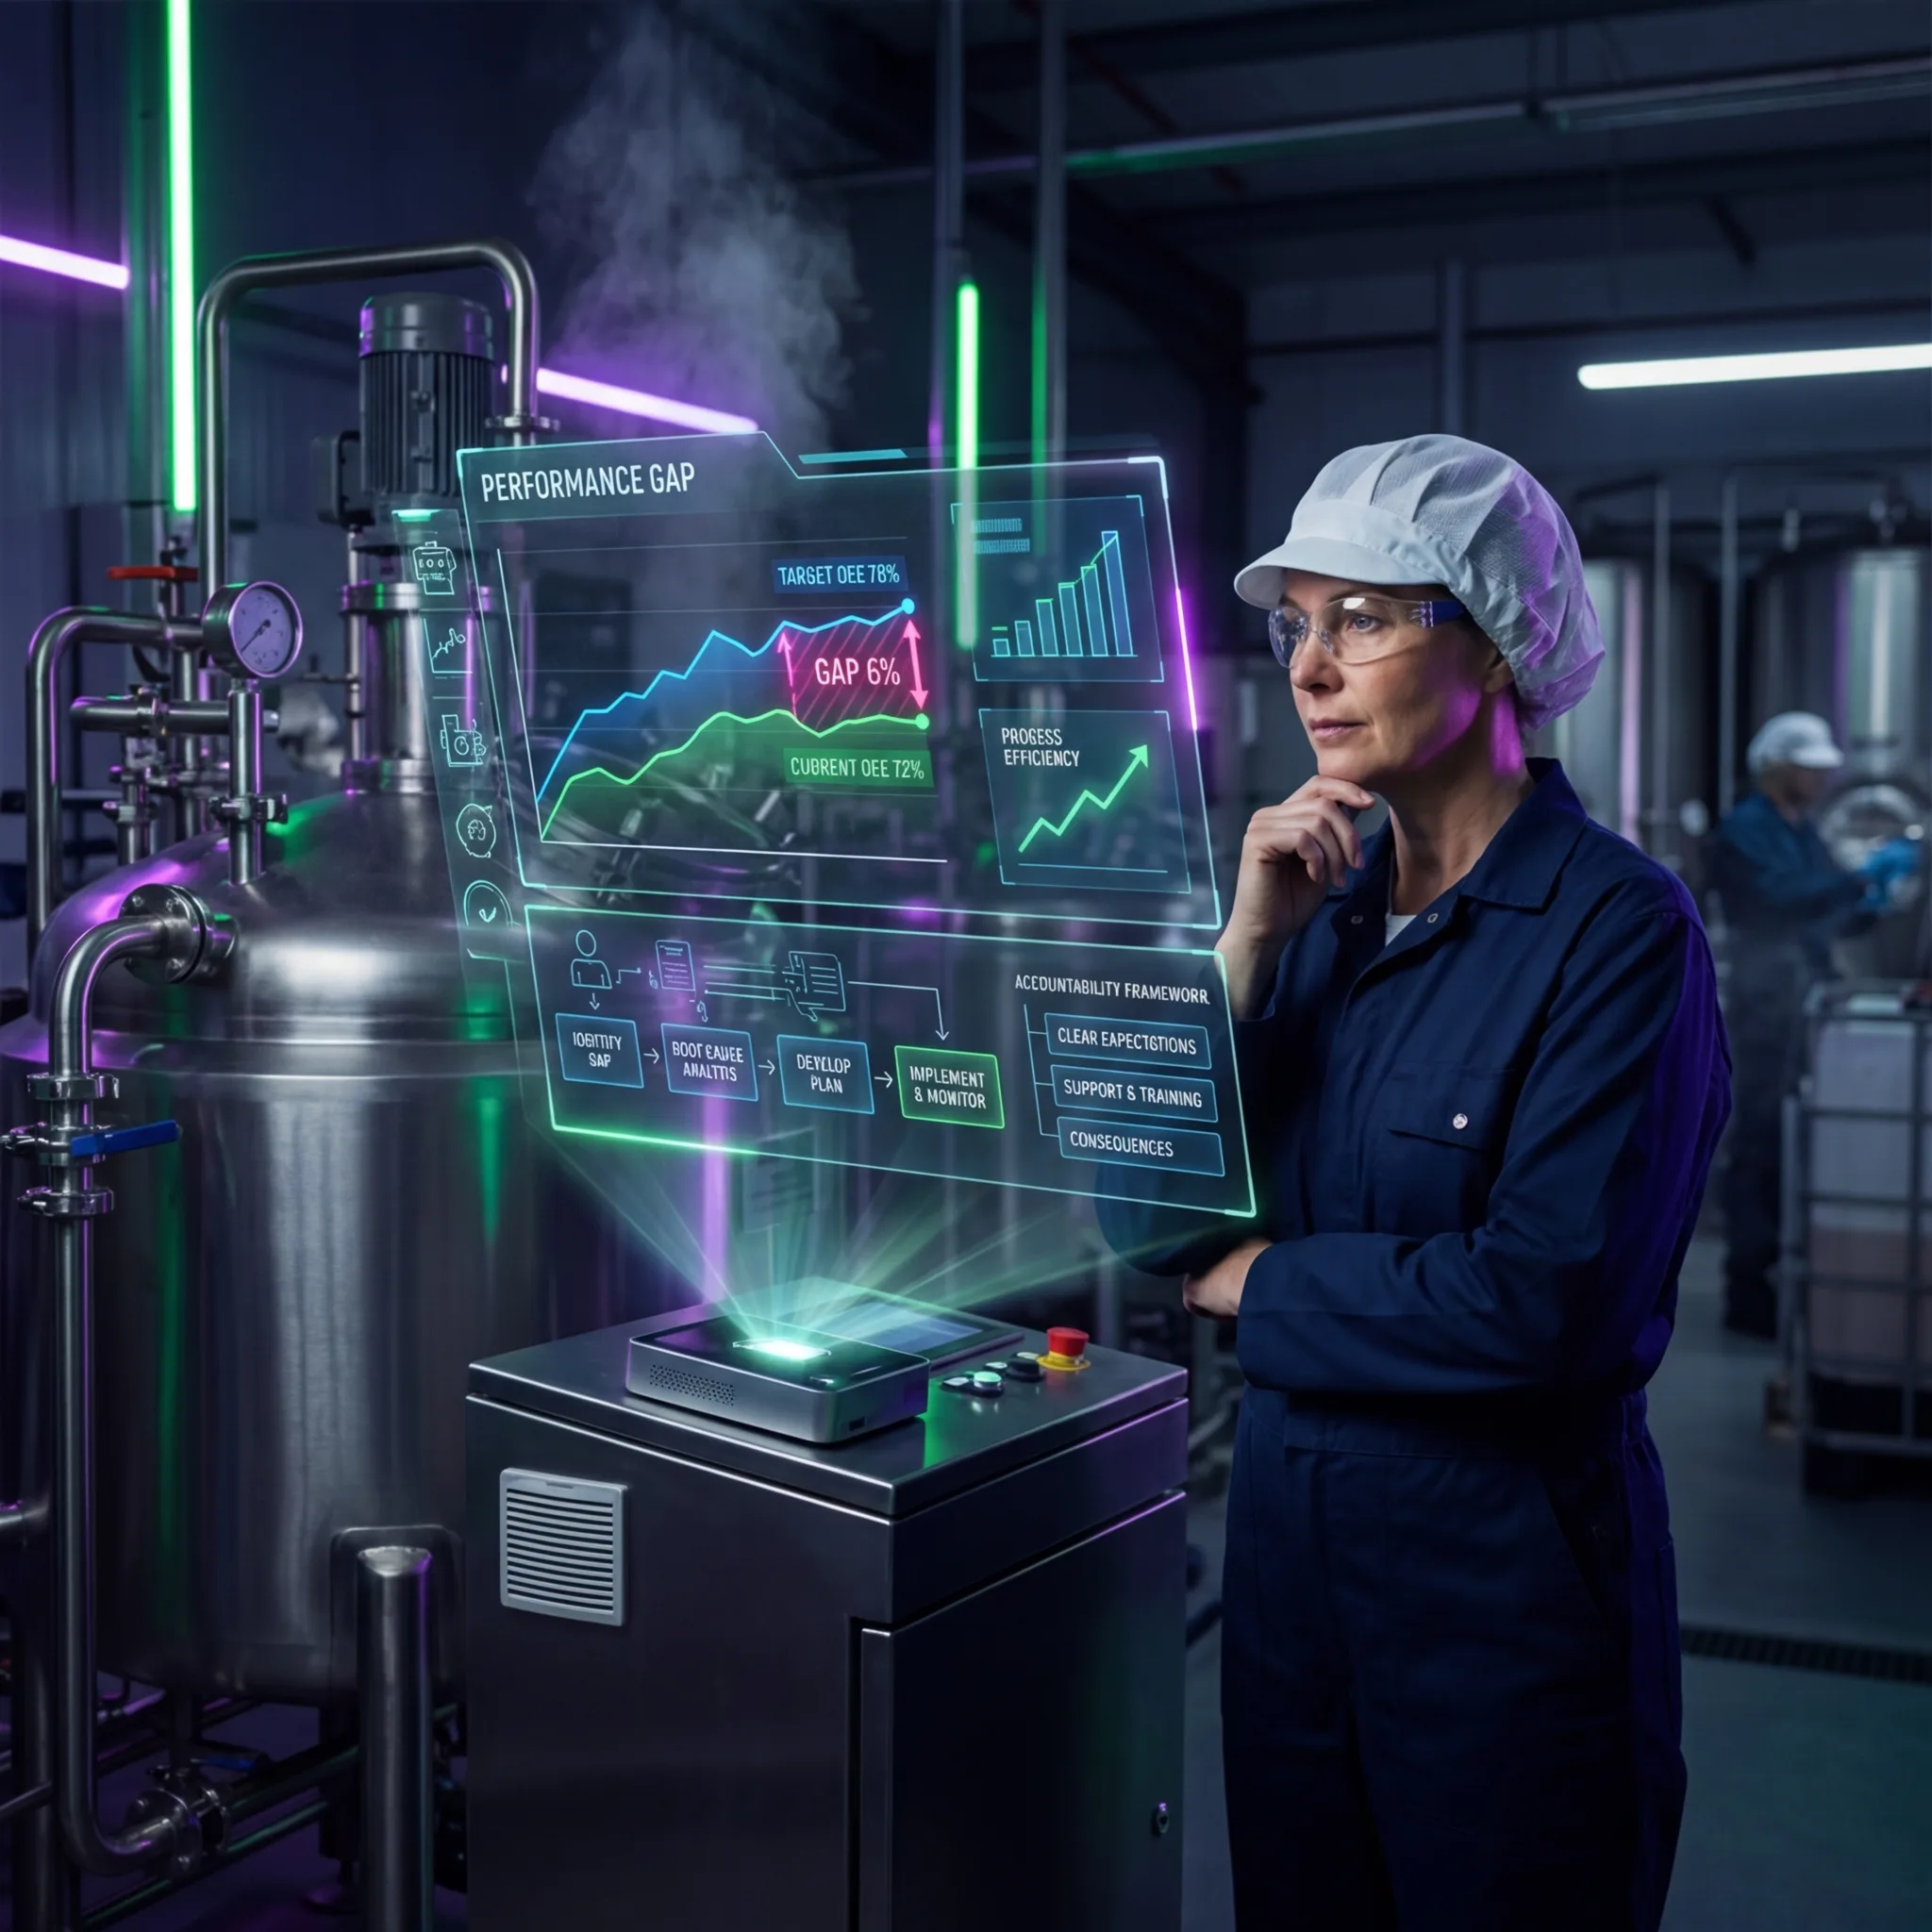
A production line misses efficiency targets for 6 months with no improvement. Structured PIPs address underperformance with clear expectations, support, and consequences.

3 min read
Plant engineer inspecting stainless steel sanitary piping connections with holographic overlays showing flow velocity specifications, dead leg elimination guidelines, and 316L material callouts
Process Improvement

Piping Systems Design: Material, Layout, and Standards

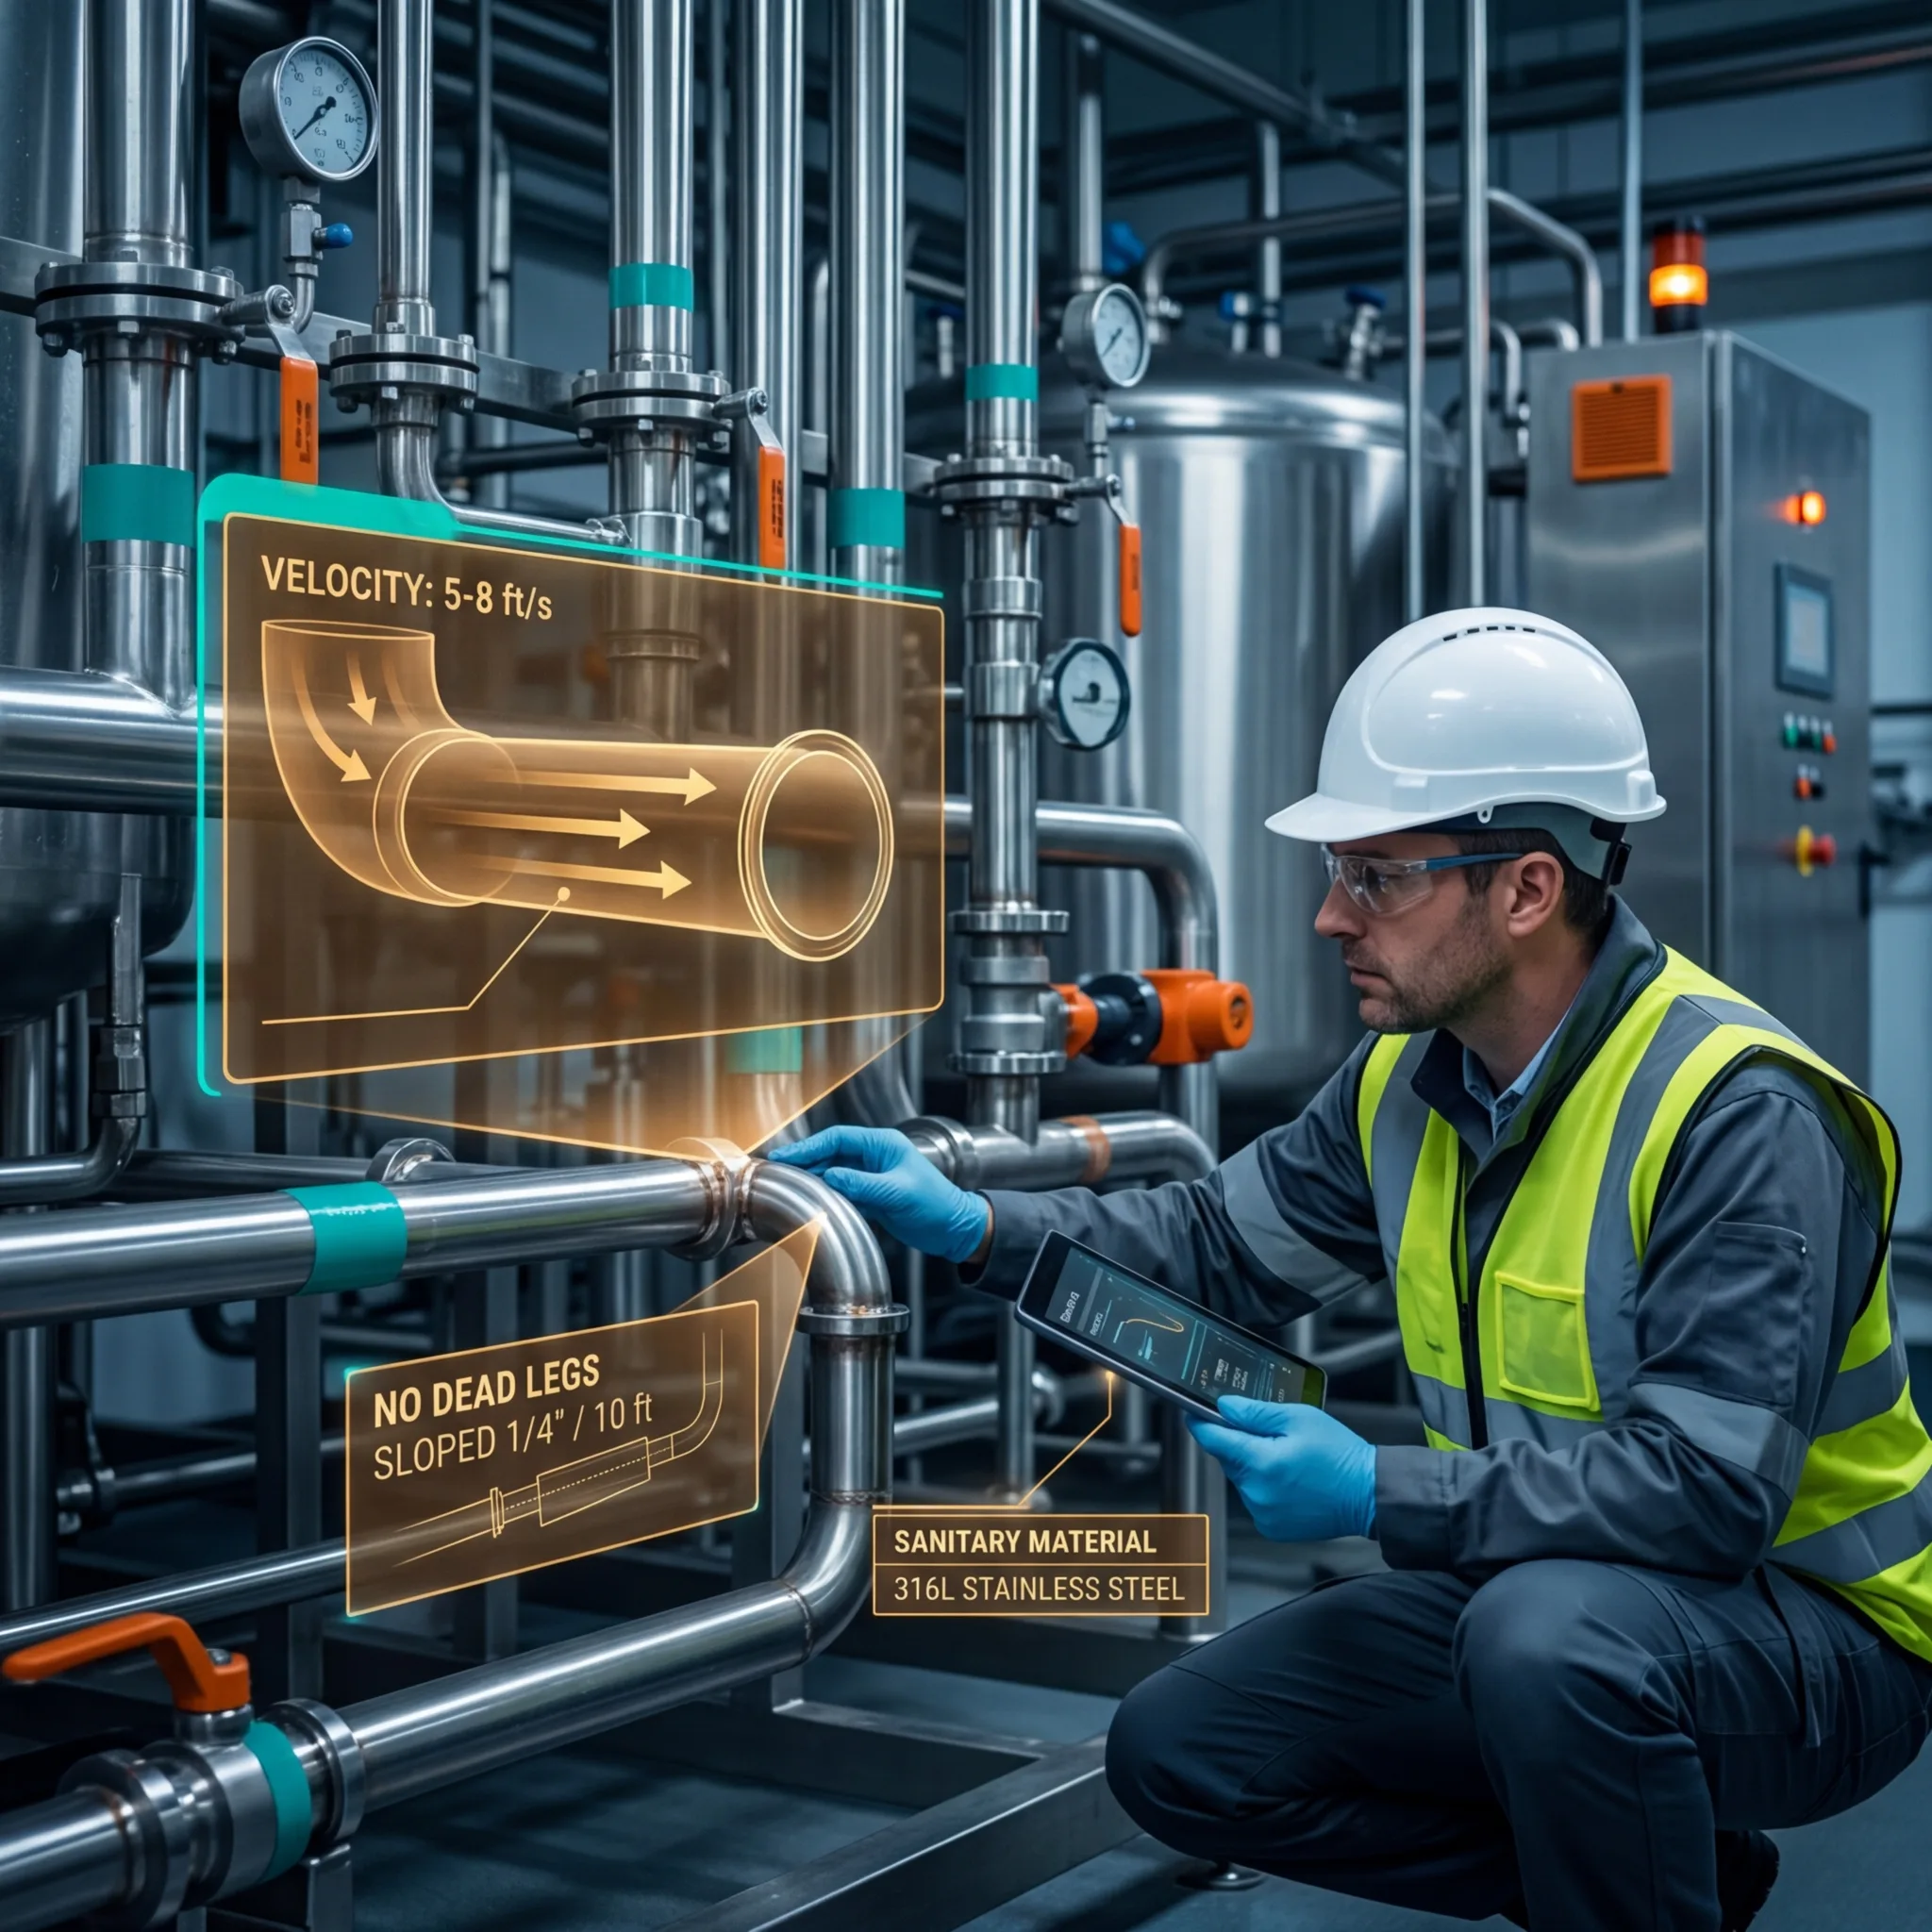
Piping system design is foundational to food safety and CIP effectiveness. Here's the engineering framework for material selection, flow velocity, and dead leg elimination.

4 min read
Two professionals reviewing post-project analytics and performance dashboards overlooking a food manufacturing floor
Capital Planning

Post-Project Review: Capturing Lessons Learned for Continuous Improvement

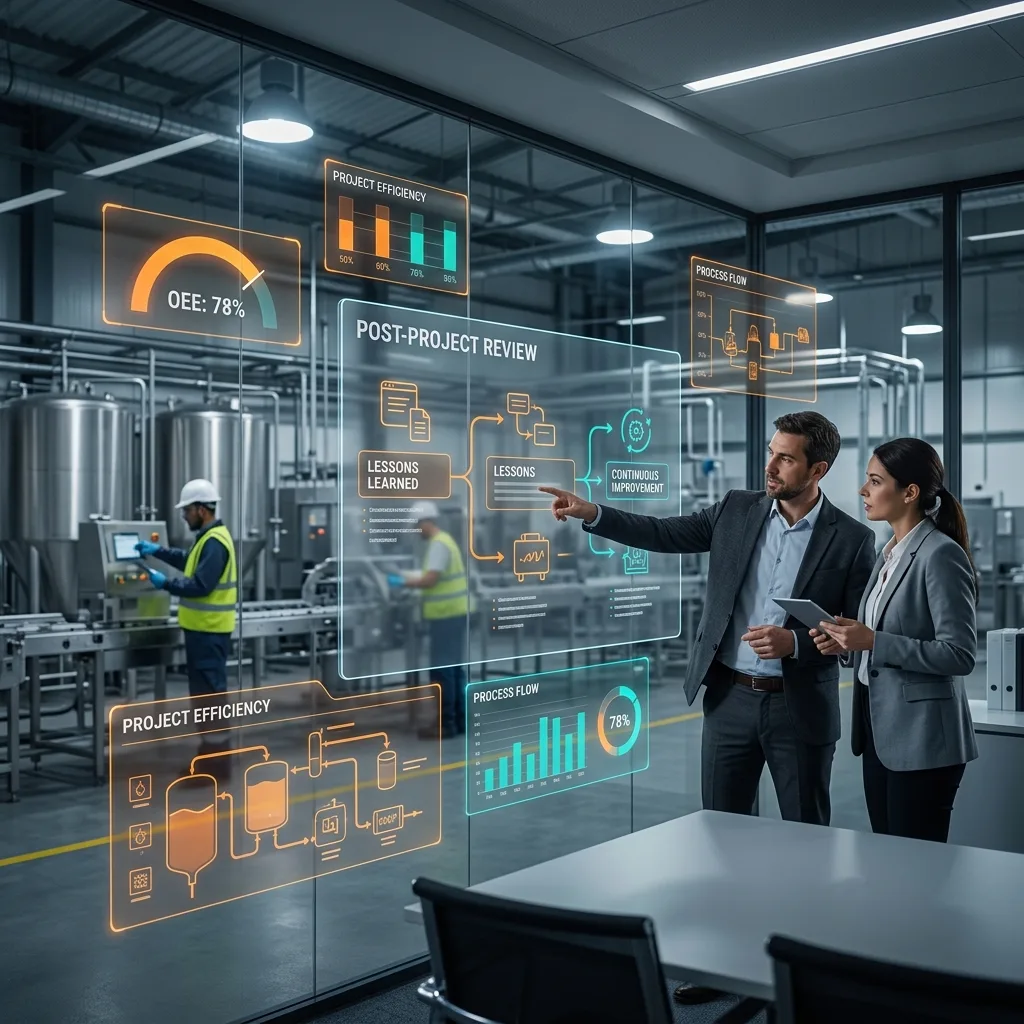
Each project learns hard lessons, then organizational memory evaporates. Here's the structured review process that breaks the cycle.

3 min read
Engineer reviewing digital analytics displays in a food manufacturing facility with stainless steel processing equipment
Capital Planning

The 6-18 Month Pre-Sale Capital Roadmap: Value Creation for Sellers and PE Buyers

A detailed capital roadmap shifts buyer perception from risk to opportunity. Here's the three-tier framework that demonstrates operational discipline and drives higher valuations.

3 min read
Operator adjusting processing equipment with digital SKU rationalization and portfolio optimization metrics
Industry Insights

Product Line Management: Portfolio Optimization and SKU Rationalization

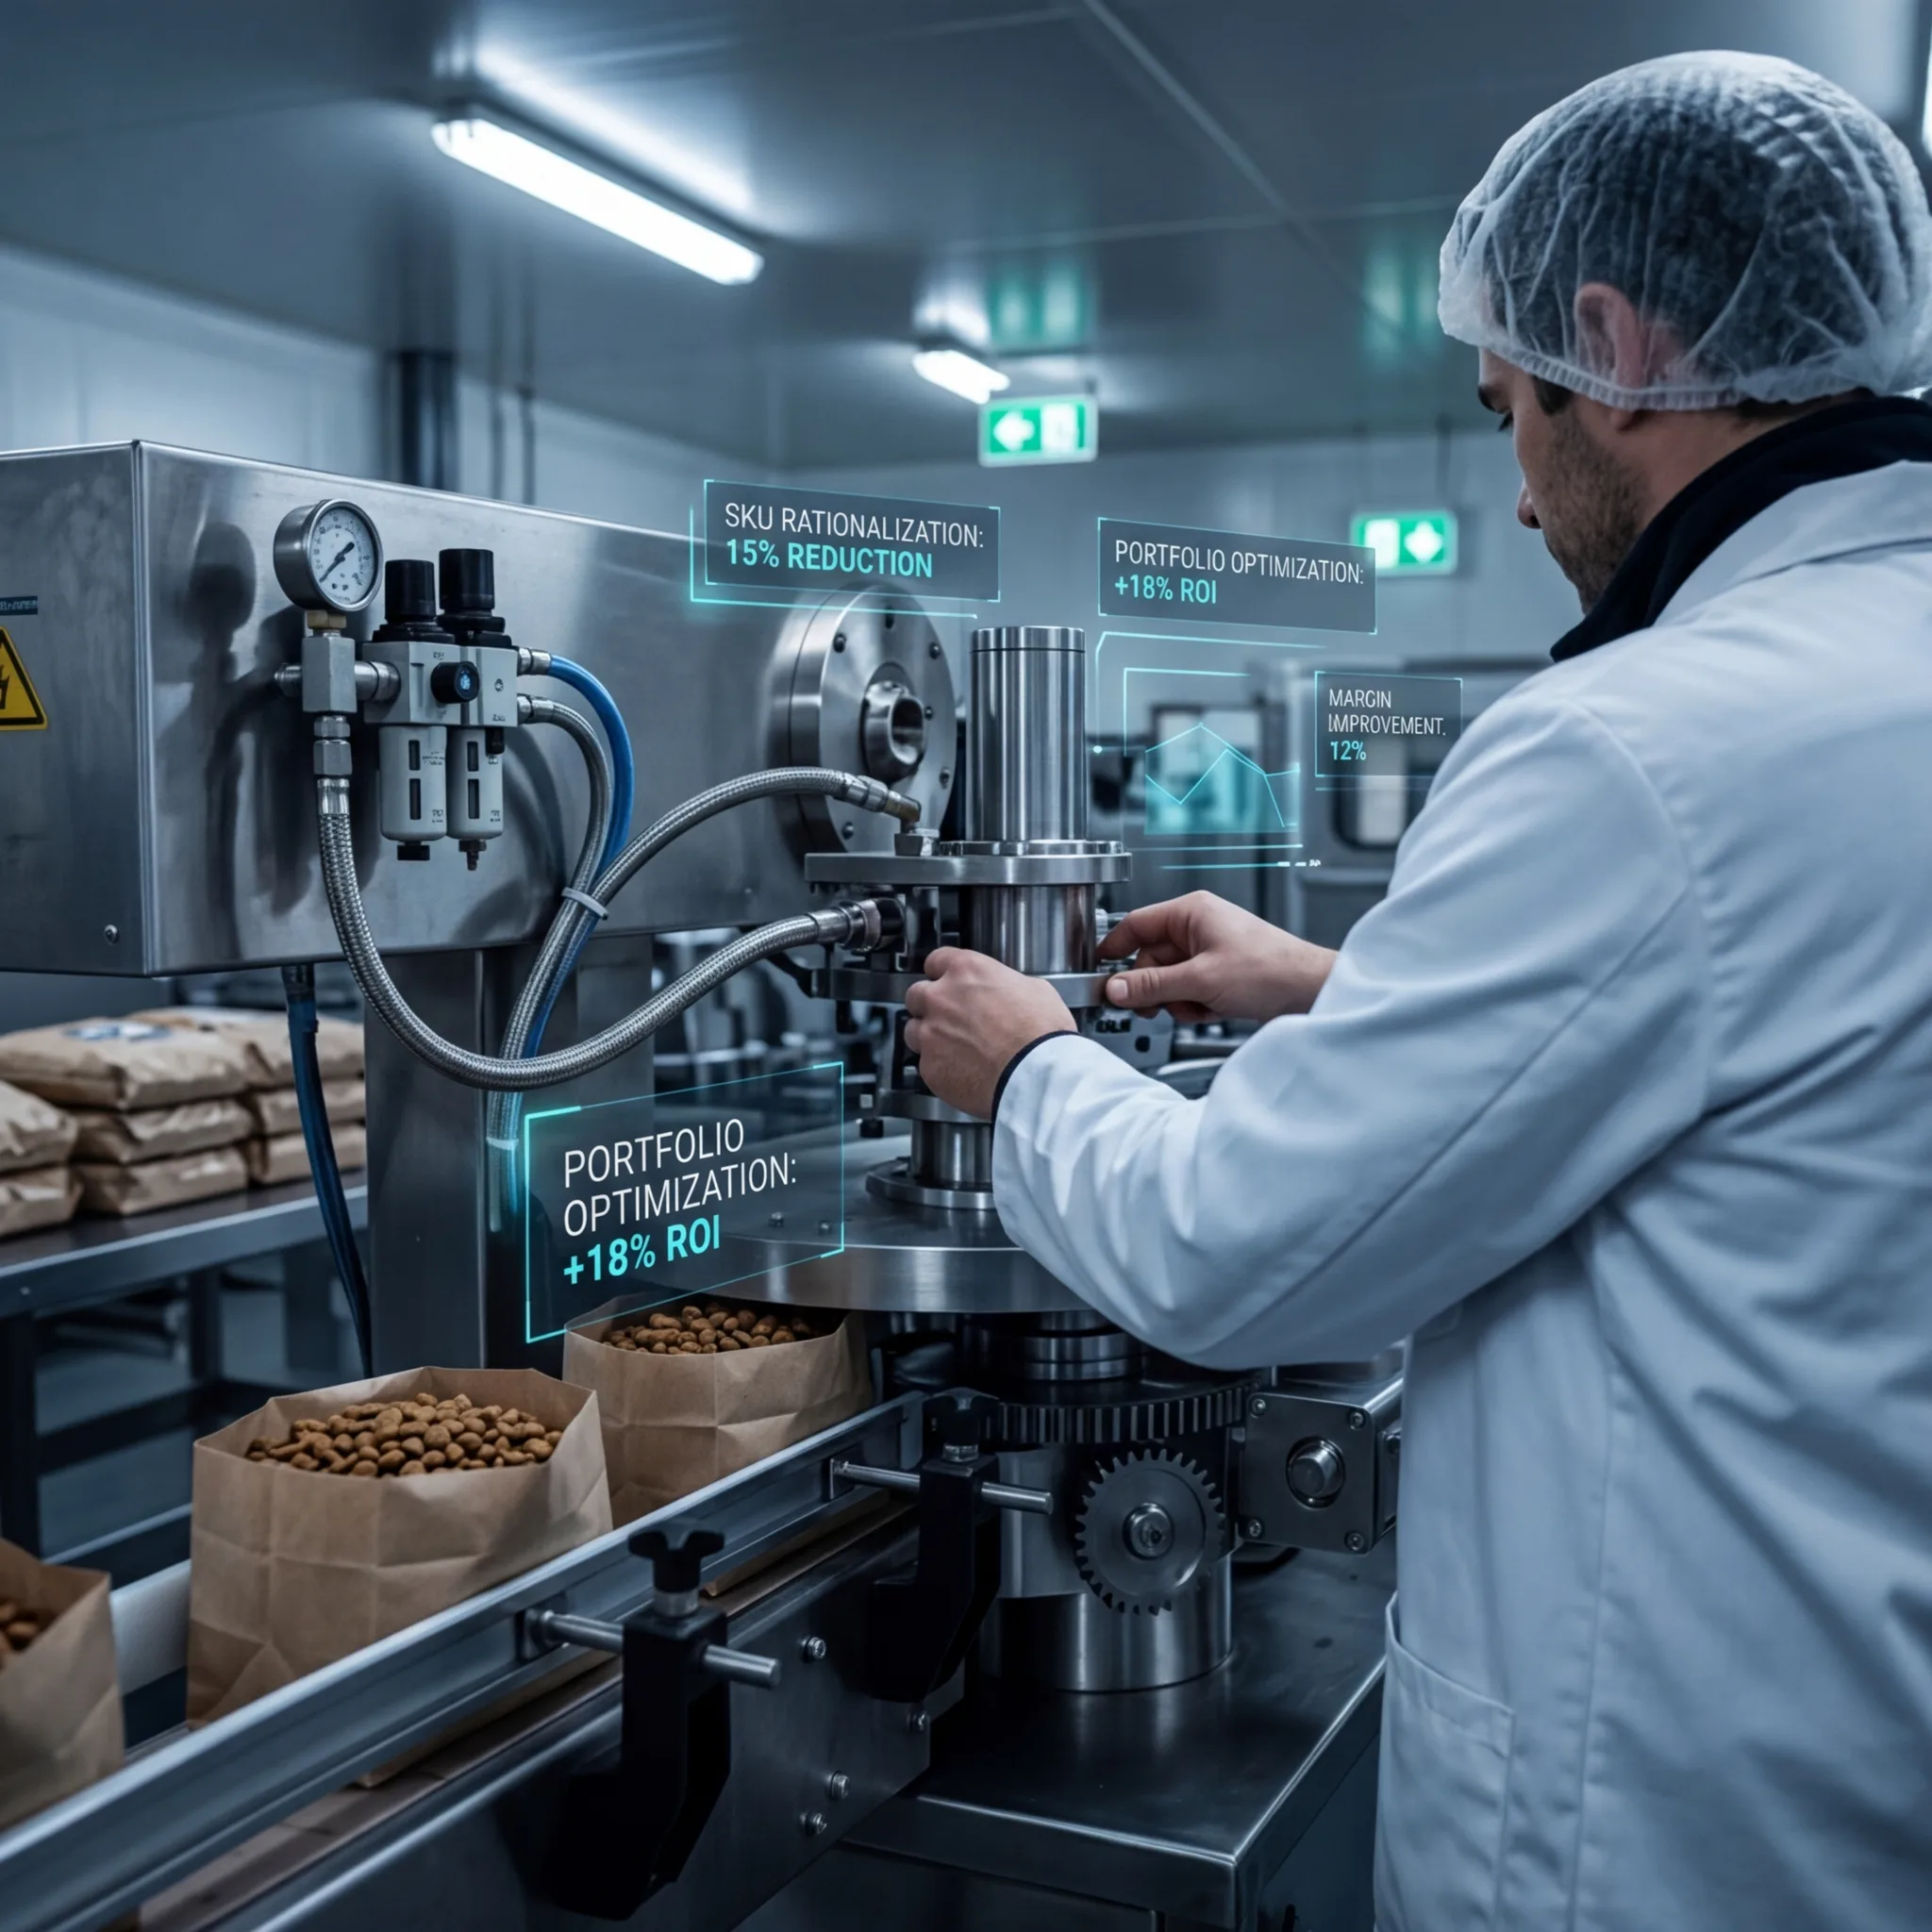
Only 20 of your 80 SKUs generate 80% of revenue. The remaining 60 cost $300K-$960K annually. Here's the rationalization framework.

3 min read