Your managing director just handed you the operational due diligence workstream for a $180 million acquisition of MidCorp Foods, a specialty sauce manufacturer with $120 million in revenue and 14% EBITDA margins. The seller claims they've "optimized operations" and there's "limited upside remaining." Your job: validate that claim and identify the real value creation opportunities that could justify the 12x EBITDA multiple.
Three months later, your operational findings reveal $8.2 million in annual EBITDA upside — enough to improve returns from 2.1x to 2.6x over five years. The difference between a mediocre deal and a strong performer often lies in the operational due diligence work that junior analysts either nail or completely miss.
The $50 Million Mistake Most Analysts Make
Manufacturing operational due diligence isn't about touring the plant and checking boxes on equipment age. It's about understanding how operational inefficiencies directly translate to EBITDA leakage. Get this wrong, and you'll miss value creation opportunities worth 15-25% of deal value.
The most expensive mistake: treating operational due diligence as a compliance exercise rather than a value creation roadmap. Analysts who focus only on "deal risks" miss the operational improvements that drive returns in manufacturing PE deals.
Manufacturing Due Diligence Framework: The PRIME Method
P - Production Efficiency Analysis
Start with Overall Equipment Effectiveness (OEE), the gold standard for manufacturing performance measurement. World-class food manufacturers achieve 85%+ OEE, while average performers sit at 60-65%.
Key metrics to track:
- Availability: Target 90%+ (scheduled production time minus downtime)
- Performance: Target 95%+ (actual vs. theoretical production rate)
- Quality: Target 99%+ (good units vs. total units produced)
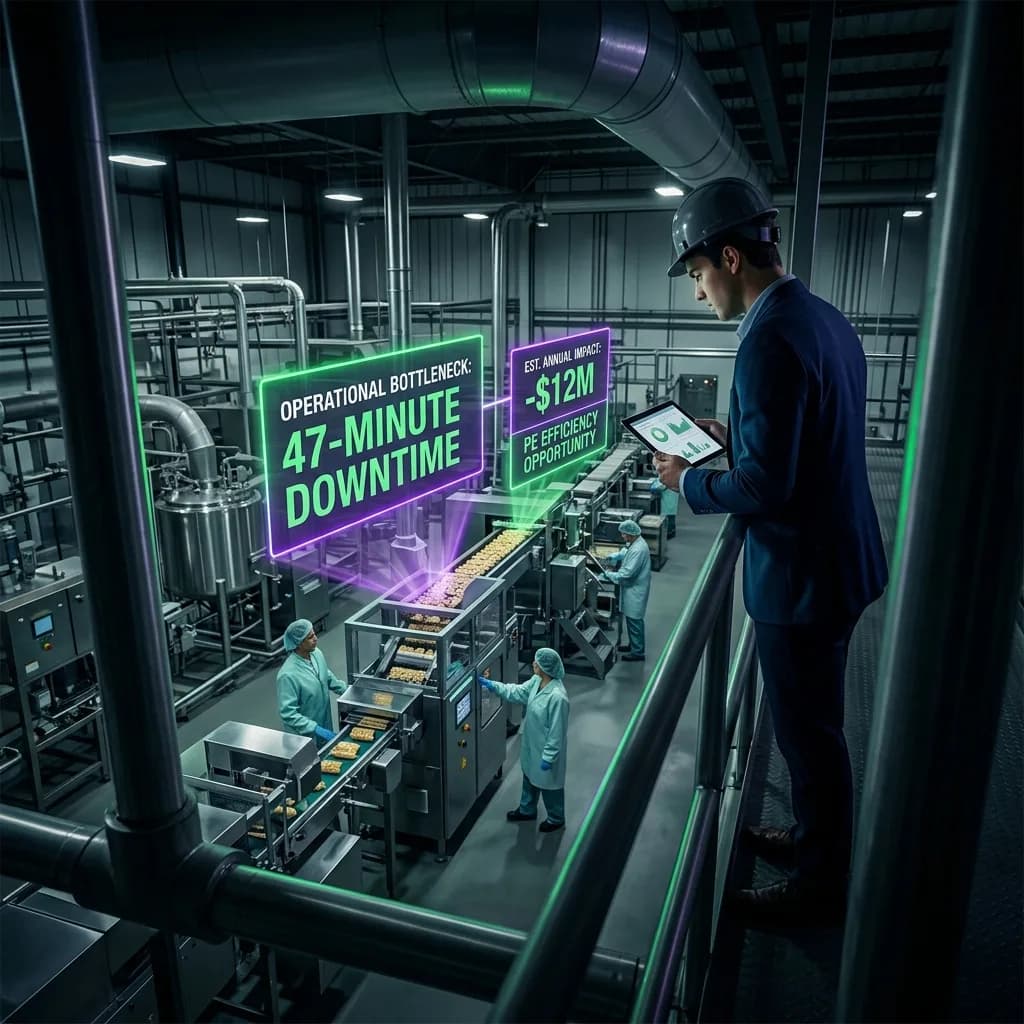
For MidCorp Foods, OEE analysis revealed 68% performance — immediately flagging $3.1 million in annual improvement potential by reaching 80% (still below world-class).
R - Raw Material and Supply Chain Optimization
Food manufacturers typically spend 60-70% of revenue on raw materials. A 2-3% improvement in procurement costs flows directly to EBITDA.
Analysis framework:
- Supplier concentration risk (no single supplier above 15% of spend)
- Contract terms benchmarking (payment terms, volume discounts)
- Inventory turns (food industry average: 12-15x annually)
- Waste and yield rates by product line
I - Infrastructure and Capacity Utilization
Manufacturing assets are expensive. Understanding true capacity utilization reveals both risk and opportunity.
Capacity analysis table:
| Production Line | Current Utilization | Theoretical Max | Constraint Factor | Investment to Debottleneck |
|---|---|---|---|---|
| Sauce Line A | 72% | 85% | Filling equipment | $450,000 |
| Sauce Line B | 89% | 95% | Packaging speed | $180,000 |
| Private Label | 45% | 80% | Demand/sales | $0 |
| Specialty Products | 91% | 95% | Raw material prep | $75,000 |
This analysis shows MidCorp has $2.8 million in revenue upside (at current margins) with $705,000 in capex investment.
M - Maintenance and Asset Reliability
Unplanned downtime costs food manufacturers $50,000-$200,000 per hour depending on line complexity. The difference between reactive and predictive maintenance programs is measurable in EBITDA terms.
Maintenance maturity levels:
- Reactive (Break-Fix): 15-20% unplanned downtime
- Preventive: 8-12% unplanned downtime
- Predictive: 3-5% unplanned downtime
- Prescriptive: 1-3% unplanned downtime
MidCorp operated at Level 2, with 11% unplanned downtime. Moving to Level 3 would reduce downtime to 4%, creating $1.8 million in annual EBITDA improvement.
E - Energy and Environmental Costs
Energy represents 3-8% of revenue for food manufacturers. Environmental compliance failures can cost $500,000-$5 million in fines plus operational disruption.
Energy audit priorities:
- Utility cost per unit of production (benchmark against industry)
- Peak demand charges (often 30-50% of total electric bill)
- Steam system efficiency (major cost driver in food processing)
- Refrigeration optimization (20-30% of total energy use)
Critical Data Points Every Analyst Must Collect
Financial-Operational Metrics
| Metric | Industry Benchmark | Red Flag Threshold | EBITDA Impact |
|---|---|---|---|
| Labor as % of Revenue | 12-18% | Above 22% | 1% = $1.2M annually |
| Material Yield Rate | 92-96% | Below 88% | 1% = $800K annually |
| Inventory Turns | 12-15x | Below 8x | 2x improvement = $400K working capital |
| Customer Concentration | Top 5 under 60% | Single customer above 25% | Risk premium: 0.5-1.0x multiple |
Operational Risk Indicators
- Regulatory compliance gaps: FDA warning letters, state health department violations
- Quality system maturity: SQF/BRC certification level, customer audit scores
- Supply chain resilience: Single-source ingredients, geographic concentration
- Technology debt: Legacy systems, manual processes, integration gaps
The 48-Hour Plant Assessment Protocol
When you have limited time on-site, focus on these high-impact observations:
Hour 1-8: Financial Reality Check
Walk the production floor during peak shift. Count active operators, measure actual line speeds, observe material handling. Compare to the financial model assumptions.
Red flags:
- Operators standing idle (overcapacity or inefficiency)
- Manual material handling (automation opportunity)
- Excessive work-in-process inventory (flow problems)
- Quality inspectors rejecting high percentages (yield issues)
Hour 9-24: Process Deep Dive
Shadow the plant manager and production supervisors. Focus on constraint identification and improvement opportunities.
Key questions:
- "What stops production most frequently?" (reliability issues)
- "Which products have the worst margins?" (complexity costs)
- "What would you fix with unlimited budget?" (prioritization insight)
- "How do you measure daily performance?" (management system maturity)
Hour 25-48: Strategic Validation
Meet with engineering, quality, and maintenance managers. Validate improvement opportunities and investment requirements.
Translating Operational Findings to Investment Returns
The ultimate test: can you quantify how operational improvements impact deal returns?
MidCorp Foods Value Creation Summary
Base Case EBITDA: $16.8 million (14% margin)
Operational Improvements (Year 2-3 implementation):
- OEE improvement (68% to 80%): +$3.1 million
- Maintenance optimization: +$1.8 million
- Energy efficiency: +$0.9 million
- Procurement optimization: +$2.4 million
- Total Annual EBITDA Uplift: +$8.2 million
Investment Required: $1.8 million (payback: 2.6 months)
Pro Forma EBITDA: $25.0 million (20.8% margin)
Return Impact Analysis
- Entry Multiple: 12.0x EBITDA ($180M purchase price)
- Exit Multiple: 11.0x EBITDA (assuming multiple compression)
- Base Case Exit Value: $185M (2.1x return)
- Operational Case Exit Value: $275M (2.6x return)
The operational due diligence work identified improvements worth $90 million in exit value — a 50% return enhancement that transforms a mediocre deal into a solid performer.
Building Your Operational Due Diligence Toolkit
Manufacturing deals require specific analytical frameworks that differ from service businesses. Master these tools:
- OEE calculation and benchmarking databases
- Capacity utilization modeling (bottleneck analysis)
- Energy cost benchmarking by subsector
- Maintenance cost optimization frameworks
- Quality system maturity assessments
The analysts who excel at manufacturing due diligence don't just identify risks — they quantify improvement opportunities that create measurable value. In a market where operational improvements often drive 40-60% of total returns, this skill set separates top performers from the pack.
Your operational due diligence work isn't just about validating the deal thesis. It's about building the value creation roadmap that turns a good investment into a great one. Master these fundamentals, and you'll consistently identify the $8-15 million EBITDA improvement opportunities that make careers in manufacturing-focused PE.