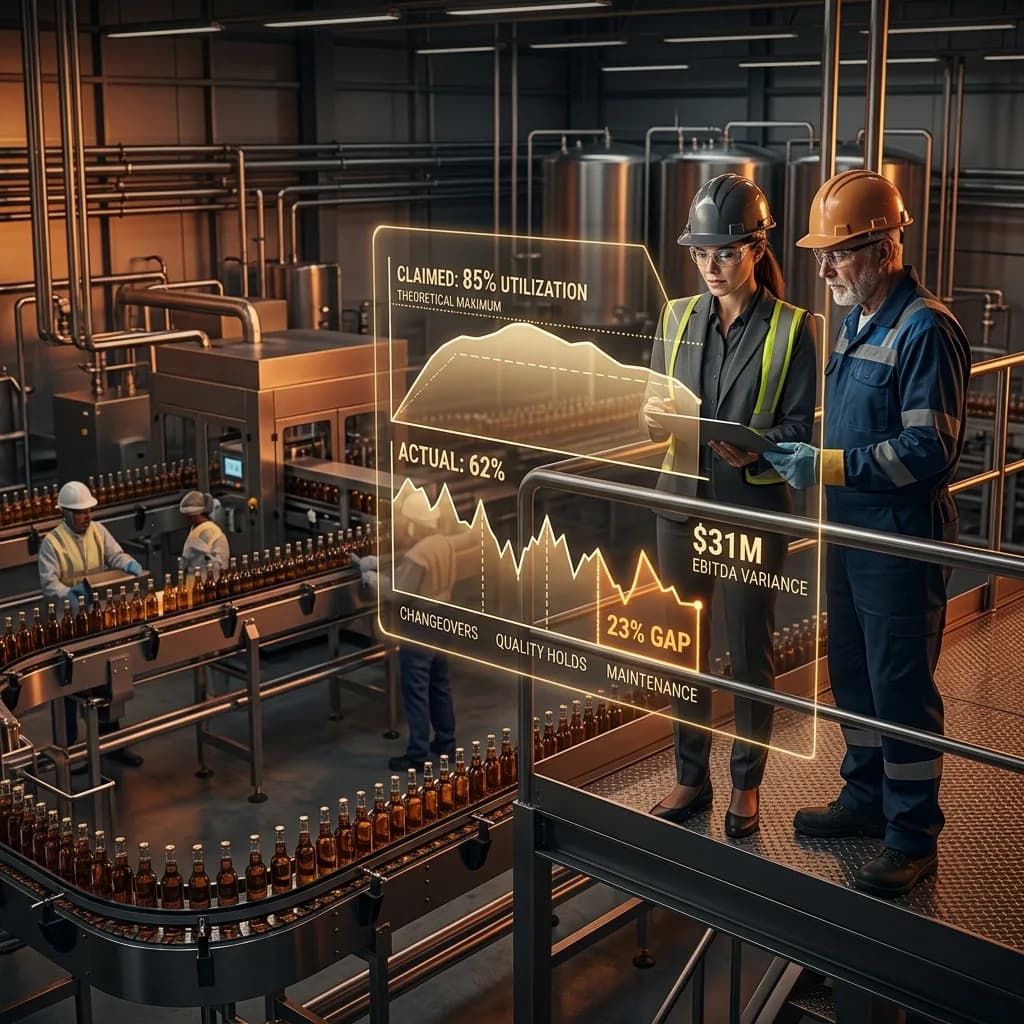
A PE fund recently walked away from a $180M beverage co-packer acquisition after discovering the target's claimed 85% capacity utilization was actually 62% when properly measured. The seller had counted theoretical line speeds without accounting for changeover times, quality holds, or maintenance windows. This 23-percentage-point gap translated to $31M in phantom EBITDA over the seller's three-year projections — nearly 20% of the purchase price.
This scenario plays out repeatedly across food and beverage deals. Management teams, often unintentionally, present capacity figures that don't reflect operational reality. Without proper validation, buyers inherit plants that can't deliver promised cash flows, leading to missed growth targets and compressed exit multiples.
The $50M Problem: Why Capacity Validation Matters
Capacity misrepresentation costs PE funds an estimated $50M annually across the food and beverage sector. The issue isn't malicious — it's methodological. Plant managers typically report theoretical capacity (what equipment can do in perfect conditions) rather than effective capacity (what it actually delivers in real operations).
The financial impact compounds quickly. A 15% capacity overstatement on a $200M revenue business operating at 12% EBITDA margins creates $3.6M in annual phantom cash flow. Over a five-year hold period at 8x exit multiples, this represents $28.8M in destroyed enterprise value.
The Three-Layer Capacity Validation Framework
Layer 1: Equipment-Level Analysis (Days 1-3)
Start with nameplate capacity verification. Request original equipment specifications, not marketing brochures. For a typical beverage line, compare these metrics:
| Equipment Component | Nameplate Rate | Typical Effective Rate | Variance |
|---|---|---|---|
| Filler (bottles/minute) | 1,200 | 950 | 21% |
| Labeler (bottles/minute) | 1,400 | 1,100 | 21% |
| Case packer (cases/minute) | 45 | 32 | 29% |
| Palletizer (cases/minute) | 50 | 38 | 24% |
The bottleneck determines true line capacity. In this example, the case packer limits throughput to 32 cases per minute, not the filler's theoretical 1,200 bottles (80 cases) per minute.
Calculate effective equipment capacity using this formula:
Effective Capacity = Nameplate Rate x Efficiency Factor x Availability Factor
Efficiency factors typically range from 75-85% for well-maintained food equipment. Availability factors (accounting for planned maintenance) range from 92-96%.
Layer 2: Operational Reality Check (Days 4-7)
Equipment specs mean nothing without operational context. Analyze these time thieves that destroy theoretical capacity:
Changeover Analysis:
- Product changeovers: 45-90 minutes per switch
- Flavor changes: 15-30 minutes
- Package size changes: 30-60 minutes
- Cleaning cycles: 60-180 minutes
A beverage plant running 12 SKUs with 2.3 changeovers per day loses 18% of theoretical capacity to changeovers alone. Document the target's changeover matrix — switching from dark to light flavors takes 40% longer than light to dark due to cleaning requirements.
Quality Hold Impact:
Request 12 months of quality hold data. Well-run plants experience holds on 2-4% of production time. Poorly managed facilities can hit 8-12%. Each percentage point of quality holds reduces effective capacity by the same amount.
Layer 3: Market Demand Validation (Days 8-10)
Capacity without demand creates no value. Validate market absorption through customer concentration analysis and demand seasonality patterns.
The Four Critical Capacity Metrics
1. Theoretical Maximum Capacity
This is nameplate equipment capacity assuming perfect conditions — no changeovers, no maintenance, no quality issues. Use this only as a starting point for analysis.
2. Design Capacity
Theoretical capacity adjusted for planned maintenance windows and standard changeover patterns. Typically 85-90% of theoretical maximum. This represents the engineering team's best-case scenario.
3. Effective Capacity
Design capacity adjusted for actual operational inefficiencies, quality holds, and unplanned downtime. Usually 70-80% of theoretical maximum. This is what the plant actually delivers in normal operations.
4. Sustainable Capacity
Effective capacity that can be maintained long-term without equipment degradation or workforce burnout. Typically 90-95% of effective capacity. This is the number that matters for investment projections.
Red Flags That Signal Capacity Inflation
Financial Red Flags
- EBITDA margins above industry benchmarks without clear operational advantages
- Revenue growth projections exceeding 15% annually without capacity expansion plans
- Working capital assumptions that don't account for inventory builds during capacity ramp-ups
Operational Red Flags
- Capacity utilization claims above 80% without detailed changeover analysis
- No documented preventive maintenance schedules
- Quality metrics that seem too good (under 0.5% defect rates in food manufacturing)
- Labor productivity numbers above industry benchmarks without automation investments
Management Red Flags
- Inability to explain capacity calculations in detail
- Defensive responses to operational questions
- Lack of real-time production data systems
- No formal capacity planning processes
The 72-Hour Capacity Audit Protocol
Hour 0-24: Data Collection
Request these documents before site visits:
- 24 months of hourly production data
- Equipment maintenance logs
- Quality hold reports
- Changeover time studies
- Labor scheduling records
- Utility consumption patterns
Hour 24-48: Physical Verification
Conduct plant walks during different shifts. Time actual changeovers. Observe material flow bottlenecks. Interview line operators (not just management) about realistic production rates.
Document equipment condition using this scoring system:
| Condition Score | Description | Capacity Impact |
|---|---|---|
| 5 | New/excellent | 100% of nameplate |
| 4 | Good | 95% of nameplate |
| 3 | Average | 85% of nameplate |
| 2 | Below average | 75% of nameplate |
| 1 | Poor | 60% of nameplate |
Hour 48-72: Analysis and Validation
Cross-reference production data with utility bills. Energy consumption should correlate with production volumes. A 500,000-case monthly beverage plant typically consumes 180-220 MWh of electricity. Significant deviations suggest production reporting issues.
Capacity Expansion Economics
When evaluating growth potential, use these benchmarks for capacity expansion costs:
Beverage Manufacturing:
- Greenfield facility: $15-25M per 100M cases annual capacity
- Brownfield expansion: $8-15M per 100M cases annual capacity
- Line additions: $3-8M per 50M cases annual capacity
Food Processing:
- Frozen food facility: $25-40M per 100M pounds annual capacity
- Dry goods packaging: $10-20M per 100M pounds annual capacity
- Fresh food processing: $20-35M per 100M pounds annual capacity
Factor in 18-36 month lead times for major capacity additions. This timeline constraint often makes acquisition-based growth more attractive than organic expansion.
Building Capacity Models for Investment Decisions
Create three-scenario capacity models:
Base Case (70% probability):
- Current effective capacity as baseline
- 3-5% annual efficiency improvements
- Market demand growth of 2-4% annually
Upside Case (20% probability):
- 15% capacity improvement through operational excellence
- Market demand growth of 5-7% annually
- Successful capacity expansion execution
Downside Case (10% probability):
- 10% capacity degradation due to equipment aging
- Market demand decline of 2-3% annually
- Delayed or failed expansion projects
Weight these scenarios when calculating investment returns. The base case should drive investment decisions, with upside providing additional return potential.
Converting Capacity Analysis to EBITDA Impact
Accurate capacity validation directly impacts investment returns through three mechanisms:
Revenue Accuracy: Proper capacity analysis prevents overestimating revenue growth potential. A 10% capacity overstatement on a $150M revenue business creates $15M in phantom revenue projections.
Capital Allocation: Understanding true capacity needs prevents both under-investment (missing growth opportunities) and over-investment (building unnecessary capacity). Proper capacity planning typically reduces required capex by 15-25% versus management's initial estimates.
Exit Multiple Protection: Buyers pay premium multiples for growth platforms with proven capacity expansion capabilities. Plants with validated capacity expansion plans command 0.5-1.0x higher exit multiples than those with uncertain growth potential.
For a typical $200M food and beverage platform, rigorous capacity validation protects $20-40M in enterprise value while enabling confident growth capital deployment. In an industry where operational excellence drives returns, capacity validation isn't due diligence overhead — it's the foundation of successful value creation.