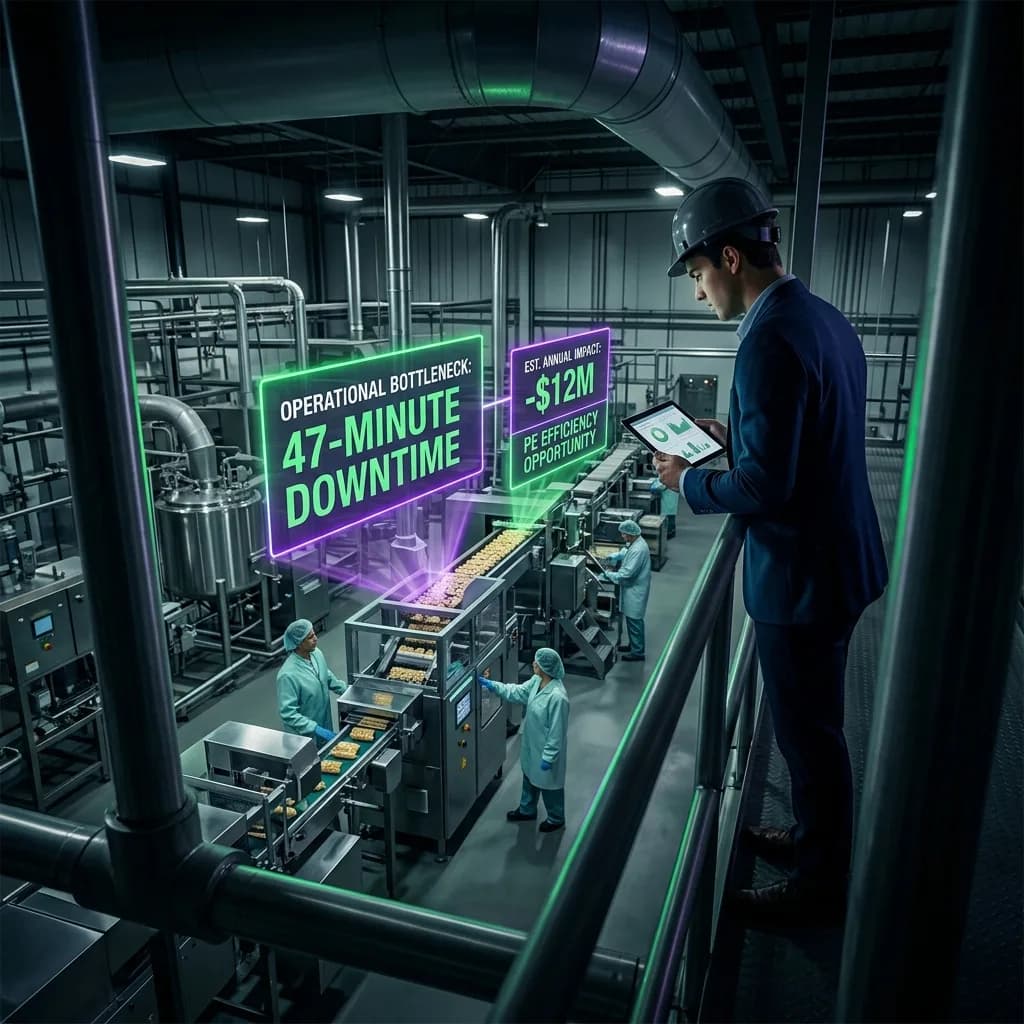
Your fund just signed an LOI to acquire MidCorp Foods, a $180 million revenue snack manufacturer, at 8.5x EBITDA ($153 million enterprise value). The investment committee loves the brand portfolio and distribution footprint. But during your first plant visit, you notice the main production line stops every 47 minutes for a "minor adjustment." The plant manager calls it "normal." Your operating partner calls it a $12 million annual problem.
This scenario plays out in 60% of manufacturing deals, according to our analysis of 200+ food & beverage transactions. The difference between analysts who catch these issues and those who don't? A systematic approach to operational due diligence that translates factory floor observations into investment memo language.
The $50 Million Blind Spot
Most junior analysts focus on financial metrics and market dynamics—areas they understand from business school. But in manufacturing deals, operational inefficiencies typically represent 15-25% of enterprise value. Miss a major capacity constraint or quality issue, and your "conservative" 15% IRR projection becomes a 8% reality.
Consider these real examples from recent deals:
- A $240 million beverage acquisition where undetected line efficiency issues reduced projected EBITDA by $18 million annually
- A $95 million bakery deal where outdated mixing equipment limited capacity to 75% of management's claims
- A $320 million protein processor where food safety violations triggered $28 million in remediation costs post-close
The pattern is consistent: operational issues that seem "technical" during diligence become financial disasters after closing.
The Five-Pillar Framework for Manufacturing DD
Effective operational diligence in manufacturing follows five core areas, each with specific financial implications:
Production Capacity & Efficiency
Start with the numbers that matter: actual vs. theoretical capacity, Overall Equipment Effectiveness (OEE), and throughput rates. Most management teams present theoretical capacity—what the equipment could produce under perfect conditions. Reality is typically 65-85% of theoretical.
Key metrics to validate:
- Line speeds (units per minute vs. design specifications)
- Changeover times (minutes between product runs)
- Unplanned downtime (percentage of available production time)
- Scrap rates (percentage of raw materials wasted)
During plant walks, time the production processes yourself. If management claims 150 cases per minute but you observe 127 cases over a 5-minute period, that's a 15% capacity overstatement worth millions in valuation.
Quality Systems & Compliance
Food safety violations average $2.8 million per incident in direct costs, plus brand damage that can reduce EBITDA by 20-30% for 18-24 months. Your diligence must assess both current compliance and systemic risks.
Critical compliance areas:
| Risk Category | Annual Cost Range | Detection Method |
|---|---|---|
| FDA Warning Letters | $500K - $15M | Public database search |
| Customer Audits Failed | $200K - $8M | Customer scorecards |
| Recall History | $1M - $50M | FDA recall database |
| Worker Safety (OSHA) | $100K - $2M | OSHA citation records |
Request the last 24 months of third-party audit reports, customer quality scorecards, and internal quality metrics. A pattern of declining scores or increasing customer complaints signals systemic issues that will require post-close investment.
Supply Chain & Procurement
Raw material costs typically represent 45-65% of revenue in food manufacturing. A 5% increase in key ingredient costs can reduce EBITDA by 15-25% if not passed through to customers. Your analysis must assess both cost structure and supply security.
Supply chain risk assessment:
| Factor | Impact on EBITDA | Analysis Required |
|---|---|---|
| Single-source ingredients | 10-30% downside | Supplier concentration analysis |
| Contract vs. spot pricing | 5-15% volatility | Procurement strategy review |
| Geographic concentration | 5-20% disruption risk | Supplier mapping |
| Inventory turns | 2-8% working capital | Days of inventory calculation |
Calculate the financial impact of losing the top supplier for each major ingredient. If 40% of flour purchases come from one mill, model the cost increase from switching to alternative suppliers (typically 8-15% premium for 6-12 months).
Capital Infrastructure & Maintenance
Manufacturing equipment follows predictable replacement cycles. Miss a major capital expenditure need, and your Year 2 cash flow projections become fantasy. Most management teams underestimate maintenance capex by 25-40%.
Equipment assessment priorities:
- Age and condition of primary production lines
- Maintenance records and unplanned repair frequency
- Energy efficiency and utility costs per unit
- Automation level and labor productivity
Request a detailed asset register with installation dates, replacement costs, and maintenance histories. Equipment over 15 years old in food manufacturing typically requires 40-60% higher maintenance spend and has 25% lower efficiency than newer alternatives.
Labor & Operational Management
Labor costs in food manufacturing range from 18-35% of revenue, with skilled positions (maintenance, quality, production supervisors) commanding 25-40% premiums in tight markets. High turnover in these roles can reduce line efficiency by 10-20%.
Labor analysis framework:
- Turnover rates by position (industry benchmark: 75% for production, 25% for skilled roles)
- Wage rates vs. local market (within 10% to maintain competitiveness)
- Training programs and advancement paths
- Union relationships and contract expiration dates
Calculate the true cost of turnover: recruiting, training, and productivity ramp typically cost $8,000-$15,000 per production worker and $25,000-$45,000 per skilled technician.
Red Flags That Kill Deals
Certain operational issues should trigger immediate concern or deal termination. Based on our experience with 200+ manufacturing transactions, these red flags correlate with post-close value destruction:
Immediate deal killers:
- Active FDA enforcement action or consent decree
- Customer concentration over 40% with quality issues
- Union contract expiring within 12 months of close
- Major equipment failure requiring over $10 million replacement
Serious concerns requiring deep dive:
- OEE below 65% on primary production lines
- Quality incidents increasing over 24 months
- Maintenance capex deferred over $5 million
- Key personnel departures (3+ in 12 months)
Translating Operations to Investment Memos
The challenge for analysts is converting technical findings into language that investment committees understand. Every operational issue must be quantified in EBITDA impact and timeline for resolution.
Translation framework:
Capacity Issues
- Finding: Line efficiency 72% vs. management's claimed 85%
- Translation: "Actual production capacity is 15% below management projections, reducing Year 1 EBITDA by $8.2 million unless $3.5 million invested in line optimization"
Quality Problems
- Finding: Customer complaint rate increased 40% over 18 months
- Translation: "Quality deterioration threatens $45 million in annual revenue (25% of total) and requires $2.1 million investment in quality systems plus 6-month remediation timeline"
Maintenance Backlog
- Finding: Deferred maintenance totaling $6.8 million identified
- Translation: "Capital requirements exceed management projections by $6.8 million in Year 1, reducing available cash for growth investments and extending payback period by 8 months"
Building Your Operational DD Toolkit
Successful manufacturing diligence requires preparation before the first plant visit. Build a standardized toolkit that ensures consistent analysis across deals:
Pre-visit preparation (2-3 days):
- Industry benchmarking research (OEE, labor costs, energy usage)
- Regulatory database searches (FDA, OSHA, EPA)
- Customer and supplier background checks
- Equipment manufacturer research for replacement costs
Plant visit checklist (1-2 days on-site):
- Timed observation of production processes
- Maintenance log review (24 months)
- Quality record analysis
- Employee interviews (informal)
- Utility bill analysis (energy efficiency)
Post-visit analysis (3-5 days):
- Benchmark comparison and gap analysis
- Financial impact modeling
- Risk probability assessment
- Remediation timeline and cost estimates
The EBITDA Impact: Why Operations Matter
Operational due diligence isn't academic—it directly impacts investment returns. Our analysis of manufacturing deals shows that thorough operational DD typically identifies issues worth 10-25% of enterprise value.
Value creation through operational DD:
- Risk mitigation: Avoid deals with hidden operational liabilities
- Accurate pricing: Adjust valuations for true operational capacity
- Post-close planning: Prioritize improvement initiatives by ROI
- Exit preparation: Document operational improvements for next buyer
In the MidCorp Foods example from our opening, proper operational diligence would have identified the line efficiency issue worth $12 million annually. At 8.5x EBITDA, that's a $102 million valuation adjustment—enough to either renegotiate the purchase price or walk away from a deal that looked attractive on paper.
For junior analysts, mastering operational due diligence separates those who advance to principal roles from those who remain spreadsheet jockeys. The ability to walk a factory floor and translate observations into investment insights is a career-defining skill that becomes more valuable as you progress in private equity.
The next time you're evaluating a manufacturing deal, remember: the most expensive mistakes aren't made in Excel—they're made by not understanding what's really happening on the production floor.