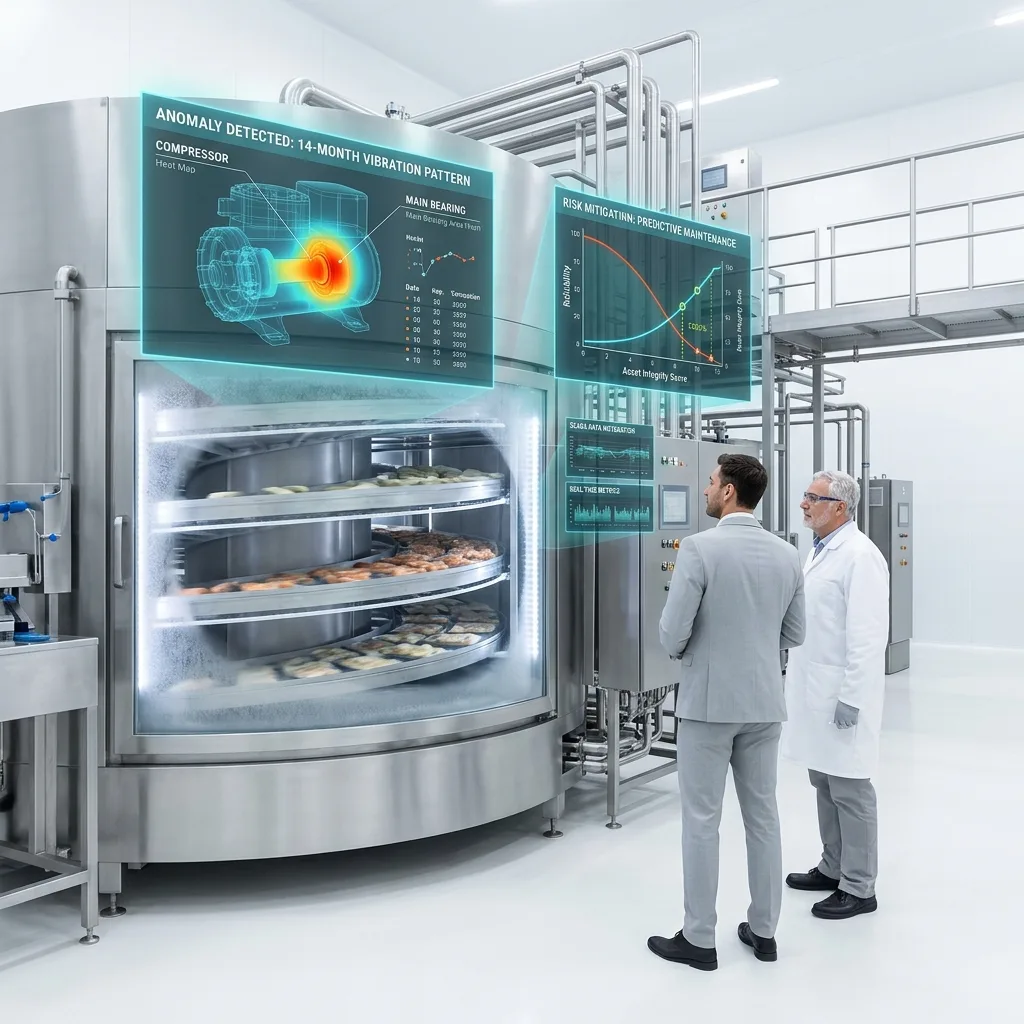
A PE deal team closes on a $72M frozen foods manufacturer after a standard 10-day operational due diligence process. Three months post-close, the plant's primary spiral freezer fails catastrophically. The rebuild costs $1.8M and idles 40% of production capacity for 11 weeks. Total impact: $4.2M in lost revenue plus the repair cost. The DD team had walked past that freezer, reviewed its maintenance records, and noted "good condition" in their report. The compressor had been showing subtle vibration pattern changes for 14 months — data that existed in the plant's SCADA system but was never analyzed. This is the gap AI-powered DD is designed to close.
The Limitations of Traditional Operational DD
Traditional operational due diligence in food manufacturing follows a well-established playbook: 2–3 weeks of document review, a 3–5 day site visit, management interviews, and a written report. It has served PE firms adequately for decades. But it carries structural limitations that become more costly as deal sizes grow and hold periods shorten.
Point-in-time snapshot. A site visit captures facility condition on the day the DD team walks the floor. Equipment that runs well on Tuesday may fail on Thursday. Seasonal variation in production stress, environmental conditions, and staffing levels are invisible in a single visit.
Reliance on management representations. DD teams ask management to provide maintenance records, equipment lists, production data, and compliance history. Management controls what gets shared. A 2023 survey of PE operating partners found that 61% had discovered material operational issues post-close that were not disclosed during DD.
Limited data analysis capacity. A typical food manufacturing facility generates 50,000–200,000 data points per day from PLCs, SCADA systems, and quality instrumentation. A DD team reviewing spreadsheets and paper logs accesses perhaps 2–5% of available operational data.
Cost and time pressure. A comprehensive traditional DD engagement for a mid-market food manufacturer costs $150K–$350K and takes 4–6 weeks. Deal timelines often compress this to 2–3 weeks, forcing triage decisions about what gets examined.
These limitations do not make traditional DD worthless — far from it. Experienced engineers and operators catch problems that no algorithm can. But the question PE firms are now asking is: what if we could layer AI analysis on top of traditional DD to close the gaps?
Six AI-Powered DD Approaches
1. IoT Sensor Data Analysis for Equipment Health Scoring
Technology: Machine learning models trained on vibration, temperature, pressure, and power consumption data from equipment sensors. Algorithms detect degradation patterns months before human-observable failure indicators appear.
How it works in DD: The DD team requests 12–24 months of raw sensor data (or SCADA historian exports) from the target's critical equipment. AI models score each asset on a 0–100 health index, flag equipment with predicted failure windows under 12 months, and estimate remaining useful life.
Current maturity: High. Predictive maintenance AI is the most proven technology on this list. Companies like Augury, Senseye, and SparkCognition offer commercial platforms with food manufacturing-specific models.
Cost: $25K–$75K for a DD-scope analysis of 20–50 critical assets. Ongoing monitoring subscriptions run $3K–$8K per asset annually.
Accuracy vs. traditional: Equipment health scoring identifies 70–85% of failures within a 6-month prediction window, versus 30–40% detection rates from visual inspection and maintenance record review during traditional DD.
PE adoption: Approximately 15–20% of food-focused PE firms now request sensor data analysis as part of DD. Upper-middle-market firms ($100M+ deals) lead adoption.
2. Computer Vision for Facility Condition Assessment
Technology: Convolutional neural networks trained on images of food manufacturing equipment, facility surfaces, and infrastructure. Models classify condition states (corrosion severity, surface wear, coating integrity, sanitary design compliance) from photographs or video.
How it works in DD: High-resolution photos or video captured during the site visit are processed through CV models. The system generates a facility condition score, flags areas of concern, and benchmarks against a reference database of similar facilities.
Current maturity: Medium. Models perform well on specific tasks (corrosion detection accuracy exceeds 90%) but struggle with holistic facility assessment. Food manufacturing-specific training data remains limited compared to general industrial applications.
Cost: $15K–$40K for a full-facility assessment. Requires structured photo/video capture during the site visit (add 4–8 hours of on-site time).
Accuracy vs. traditional: Outperforms human visual inspection for surface-level defects by 15–25% (humans miss small corrosion patches, early-stage coating failures). Underperforms experienced engineers for systemic issues (e.g., recognizing that a floor drain pattern indicates poor sanitary design).
PE adoption: Under 10%. Most adoption is in real estate-focused DD rather than operational DD.
3. Predictive Maintenance Analytics as DD Signals
Technology: Time-series analysis of maintenance work orders, spare parts consumption, and downtime logs. ML models identify facilities trending toward reliability crisis versus those with stable or improving maintenance maturity.
How it works in DD: The DD team ingests 2–3 years of CMMS data (work orders, PM completion rates, parts spend by equipment). The model outputs a maintenance maturity score, identifies equipment entering the "wear-out" phase of its lifecycle, and projects 3-year maintenance CapEx requirements.
Current maturity: Medium-high. The underlying analytics are straightforward, but data quality from target companies varies widely. Approximately 40% of mid-market food manufacturers run CMMS systems with sufficient data quality for meaningful analysis.
Cost: $20K–$50K including data cleaning and normalization.
Accuracy vs. traditional: Maintenance CapEx projections from AI analysis are within 15–20% of actual spend over a 3-year period, versus 30–50% variance from traditional DD estimates based on management interviews and visual assessment.
PE adoption: 20–25%. This is the second most adopted AI-powered DD technique after sensor data analysis.
| AI DD Approach | Maturity | DD Cost | Accuracy vs. Traditional | PE Adoption Rate | Time to Deploy |
|---|---|---|---|---|---|
| IoT sensor data / equipment health | High | $25K–$75K | +30–45 pp failure detection | 15–20% | 2–4 weeks |
| Computer vision / facility condition | Medium | $15K–$40K | +15–25% defect detection | under 10% | 1–2 weeks |
| Predictive maintenance analytics | Medium-High | $20K–$50K | 2x CapEx forecast accuracy | 20–25% | 2–3 weeks |
| NLP document review | Medium-High | $10K–$30K | 3–5x coverage speed | 25–30% | 1–2 weeks |
| Satellite/drone exterior assessment | Medium | $8K–$25K | N/A (additive capability) | 5–10% | 3–7 days |
| Real-time production data integration | Low-Medium | $30K–$80K | Continuous vs. snapshot | under 5% | 3–6 weeks |
4. NLP for Document Review
Technology: Large language models and natural language processing applied to unstructured documents — maintenance logs, regulatory filings, customer complaint records, supplier contracts, and audit reports.
How it works in DD: The DD team uploads the target's document room (often 5,000–20,000 pages) to an NLP platform. The system extracts key risk indicators: recurring equipment failures mentioned in maintenance narratives, regulatory warning language in FDA 483s or audit reports, liability clauses in co-manufacturing agreements, and patterns in customer complaint data that suggest emerging quality issues.
Current maturity: Medium-high. General NLP capabilities are strong, but food manufacturing domain-specific models are still developing. The technology excels at pattern detection across large document sets where human reviewers would take weeks.
Cost: $10K–$30K for a full document room analysis. Some DD advisory firms now include NLP review as a standard service.
Accuracy vs. traditional: NLP reviews 100% of documents versus the 20–40% a human team typically covers in a compressed DD timeline. False positive rates remain at 10–15%, requiring human verification of flagged items.
PE adoption: 25–30%. This is the most widely adopted AI DD tool, partly because it integrates easily into existing DD workflows and does not require target company cooperation beyond standard document sharing.
5. Satellite and Drone Imagery for Exterior Assessment
Technology: Multi-spectral satellite imagery and drone-captured aerial photography analyzed for roof condition, site drainage patterns, exterior structural integrity, and environmental compliance indicators (e.g., visible discharge, waste storage conditions).
How it works in DD: Historical satellite imagery (available back 5–10 years through commercial providers) shows facility changes over time — building additions, parking lot deterioration, roof patching patterns. Drone flights during DD capture current condition at resolutions under 1 cm per pixel.
Current maturity: Medium. The imagery capture technology is mature. Automated analysis models for food manufacturing-specific exterior assessment are still early-stage. Most value currently comes from human expert review of AI-organized imagery.
Cost: $8K–$25K. Satellite historical imagery runs $2K–$5K. Drone capture and analysis adds $6K–$20K depending on facility size.
Accuracy vs. traditional: Provides capability that traditional DD simply does not include. Most DD site visits do not involve roof inspection or aerial assessment. Drone imagery has identified $200K–$1M in previously undetected roof and exterior issues in documented case studies.
PE adoption: 5–10%. Mostly adopted by firms with real estate-heavy portfolios or in regions where environmental compliance risk is elevated.
6. Real-Time Production Data Integration
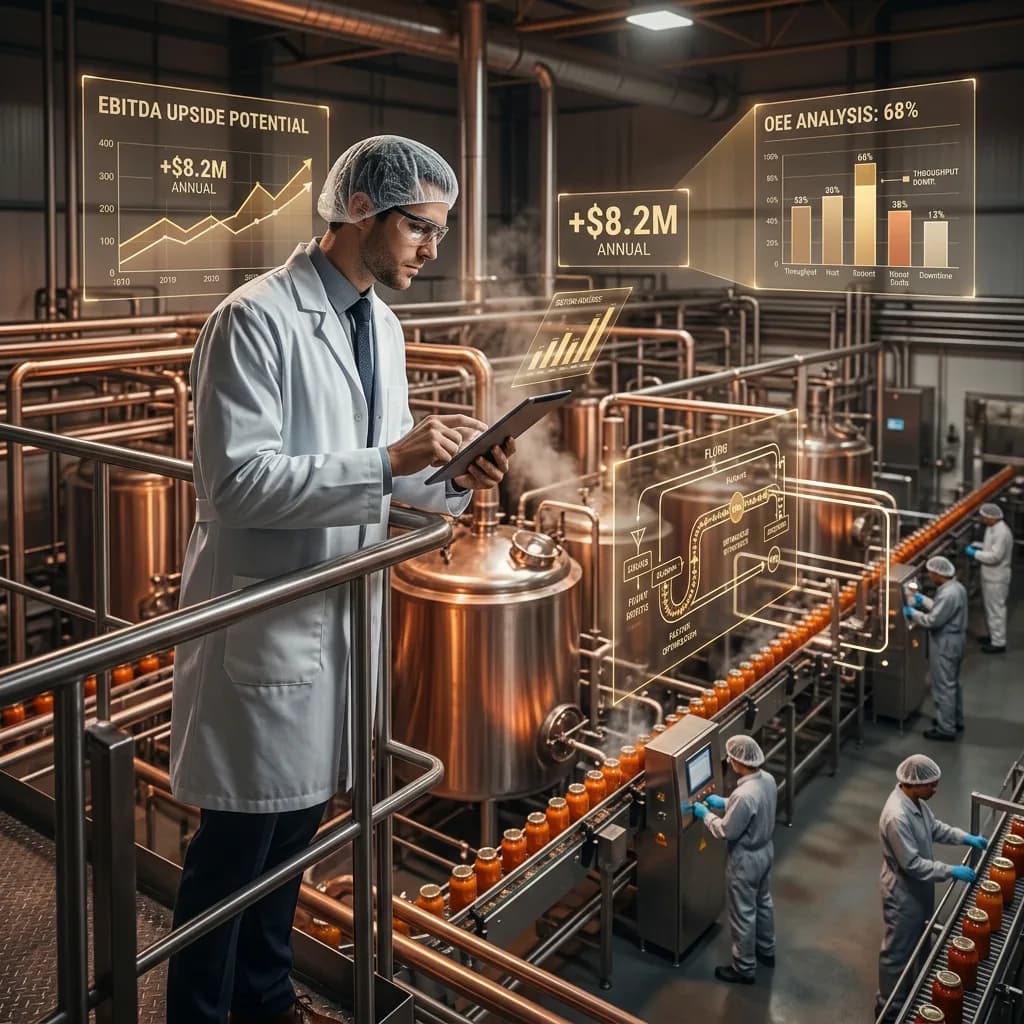
Technology: Direct API or historian connections to the target's production systems (SCADA, MES, ERP) to ingest real-time and historical production data. Analytics models calculate true OEE, identify production variability patterns, and benchmark against industry standards.
How it works in DD: With target company consent, the DD team establishes a read-only connection to production data systems. Over 2–4 weeks, the platform ingests production rates, downtime events, quality holds, and yield data. The output is a data-driven operational profile — not based on management presentations, but on what the machines actually recorded.
Current maturity: Low-medium. The analytics are proven, but gaining target company access to live production systems during DD is challenging. Data format standardization across different SCADA/MES platforms remains a barrier.
Cost: $30K–$80K including data integration, normalization, and analysis. Higher cost reflects the technical complexity of connecting to diverse industrial systems.
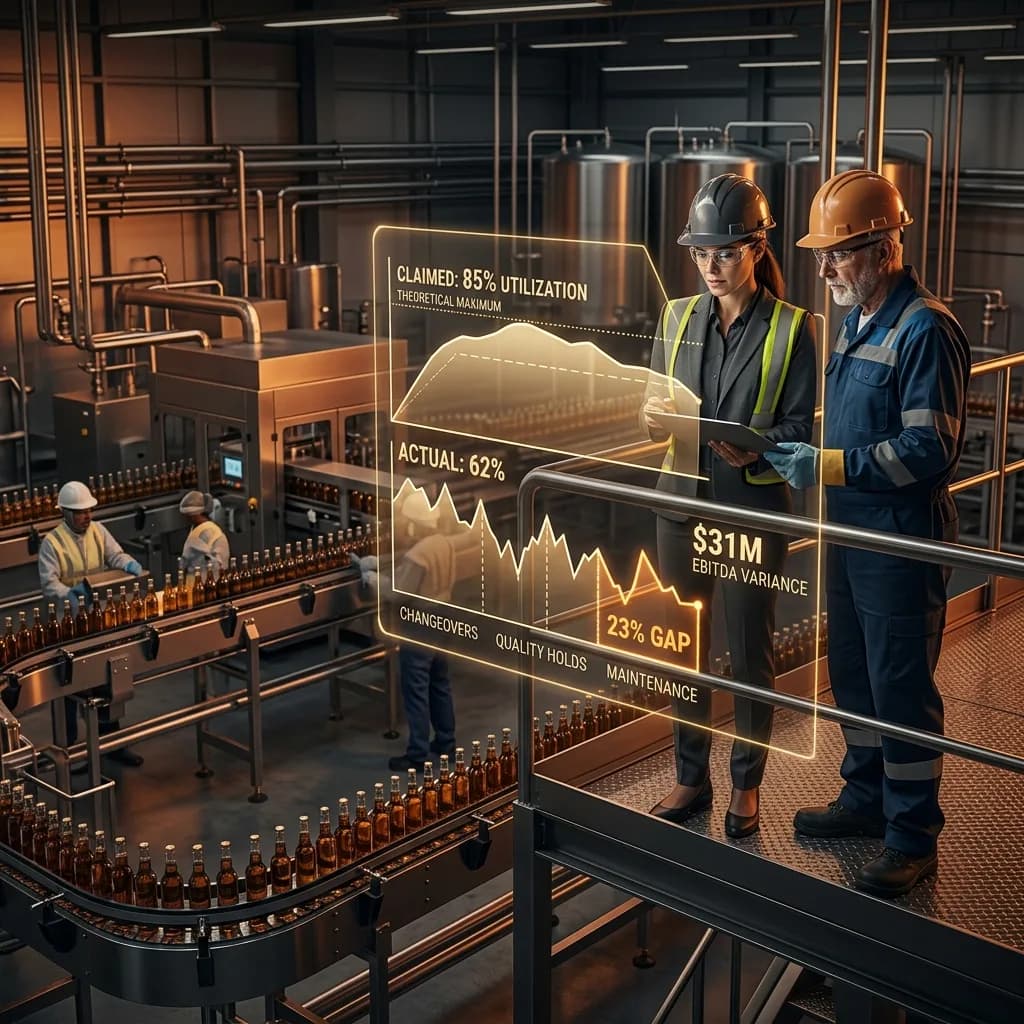
Accuracy vs. traditional: Eliminates the single largest source of DD error — reliance on management-reported production metrics. In documented cases, AI-analyzed production data revealed OEE 8–15 percentage points below management-reported figures, directly impacting valuation.
PE adoption: Under 5%. This is the most powerful but least adopted approach due to access challenges and target company reluctance.
What AI Cannot Replace
Intellectual honesty requires acknowledging what AI-powered DD cannot do. No algorithm replaces:
- Culture and management assessment. The quality of the plant manager, the attitude of the maintenance team, the relationship between operations and quality — these are human judgments that experienced DD professionals make in the first two hours of a site visit.
- Tacit knowledge extraction. The operator who knows that Line 3 runs 10% faster when ambient humidity drops below 40% is not captured in any dataset. Management interviews surface this intelligence.
- Regulatory relationship assessment. Whether the facility has a constructive or adversarial relationship with its FDA or USDA inspector matters enormously. This is a human conversation.
- Strategic context. AI can tell you the equipment health score is 62/100. It cannot tell you whether the right response is a $3M rebuild or a $15M greenfield relocation based on the 5-year product strategy.
The correct model is augmentation, not replacement. AI-powered tools handle data volume and pattern detection. Human experts handle judgment, context, and strategy.
Building a Technology-Enabled DD Framework
For PE firms ready to integrate AI into their DD process, the practical implementation follows a phased approach:
Phase 1 (Immediate, $10K–$30K added cost): Add NLP document review and predictive maintenance analytics to every DD engagement. These require only standard document room access and CMMS data exports — no special target company cooperation.
Phase 2 (Next 12 months, $25K–$75K added cost): Request raw sensor data from critical equipment as a standard DD data request. Engage a predictive maintenance analytics provider to generate equipment health scores. This becomes a standard line item in the DD scope.
Phase 3 (18–36 months, $30K–$80K added cost): For platform acquisitions where the firm has an ongoing relationship, negotiate real-time production data access during exclusivity. Use continuous data integration to validate management representations against actual production performance.
| Phase | Tools Added | Incremental Cost | Risk Reduction Value | Implementation Barrier |
|---|---|---|---|---|
| Phase 1 | NLP + maintenance analytics | $10K–$30K | Identifies 60–70% of document-hidden risks | Low — uses existing DD data |
| Phase 2 | Sensor data + equipment scoring | $25K–$75K | Predicts 70–85% of near-term equipment failures | Medium — requires data request |
| Phase 3 | Real-time production integration | $30K–$80K | Validates OEE and throughput claims with actual data | High — requires target cooperation |
The EBITDA Case for Technology-Enabled DD
The ROI calculation for AI-augmented DD is not abstract. Consider a PE firm making 4 food manufacturing acquisitions per year at an average EV of $60M. Traditional DD misses material operational issues in approximately 40% of deals, with an average post-close surprise cost of $1.5M per affected deal. That is $2.4M in annual aggregate surprise cost across the portfolio.
Adding Phase 1 and Phase 2 AI tools to every DD engagement costs $140K–$420K per year across 4 deals. If technology-enabled DD reduces the miss rate from 40% to 15%, the annual surprise cost drops to $900K — a net savings of $1.1M–$1.4M per year after tool costs. Over a 5-year fund life, that is $5.5M–$7.0M in preserved EBITDA across the portfolio.
More importantly, AI-powered DD improves deal confidence. Firms that trust their DD findings bid more aggressively on good assets and walk away faster from bad ones. In a competitive auction environment where food manufacturing platforms trade at 10–14x EBITDA, the ability to underwrite with higher confidence is a structural advantage that compounds across every deal in the portfolio.
The firms investing in technology-enabled DD today are not replacing their experienced operating partners and DD professionals. They are giving those professionals better tools — and the data shows that better tools produce better outcomes.