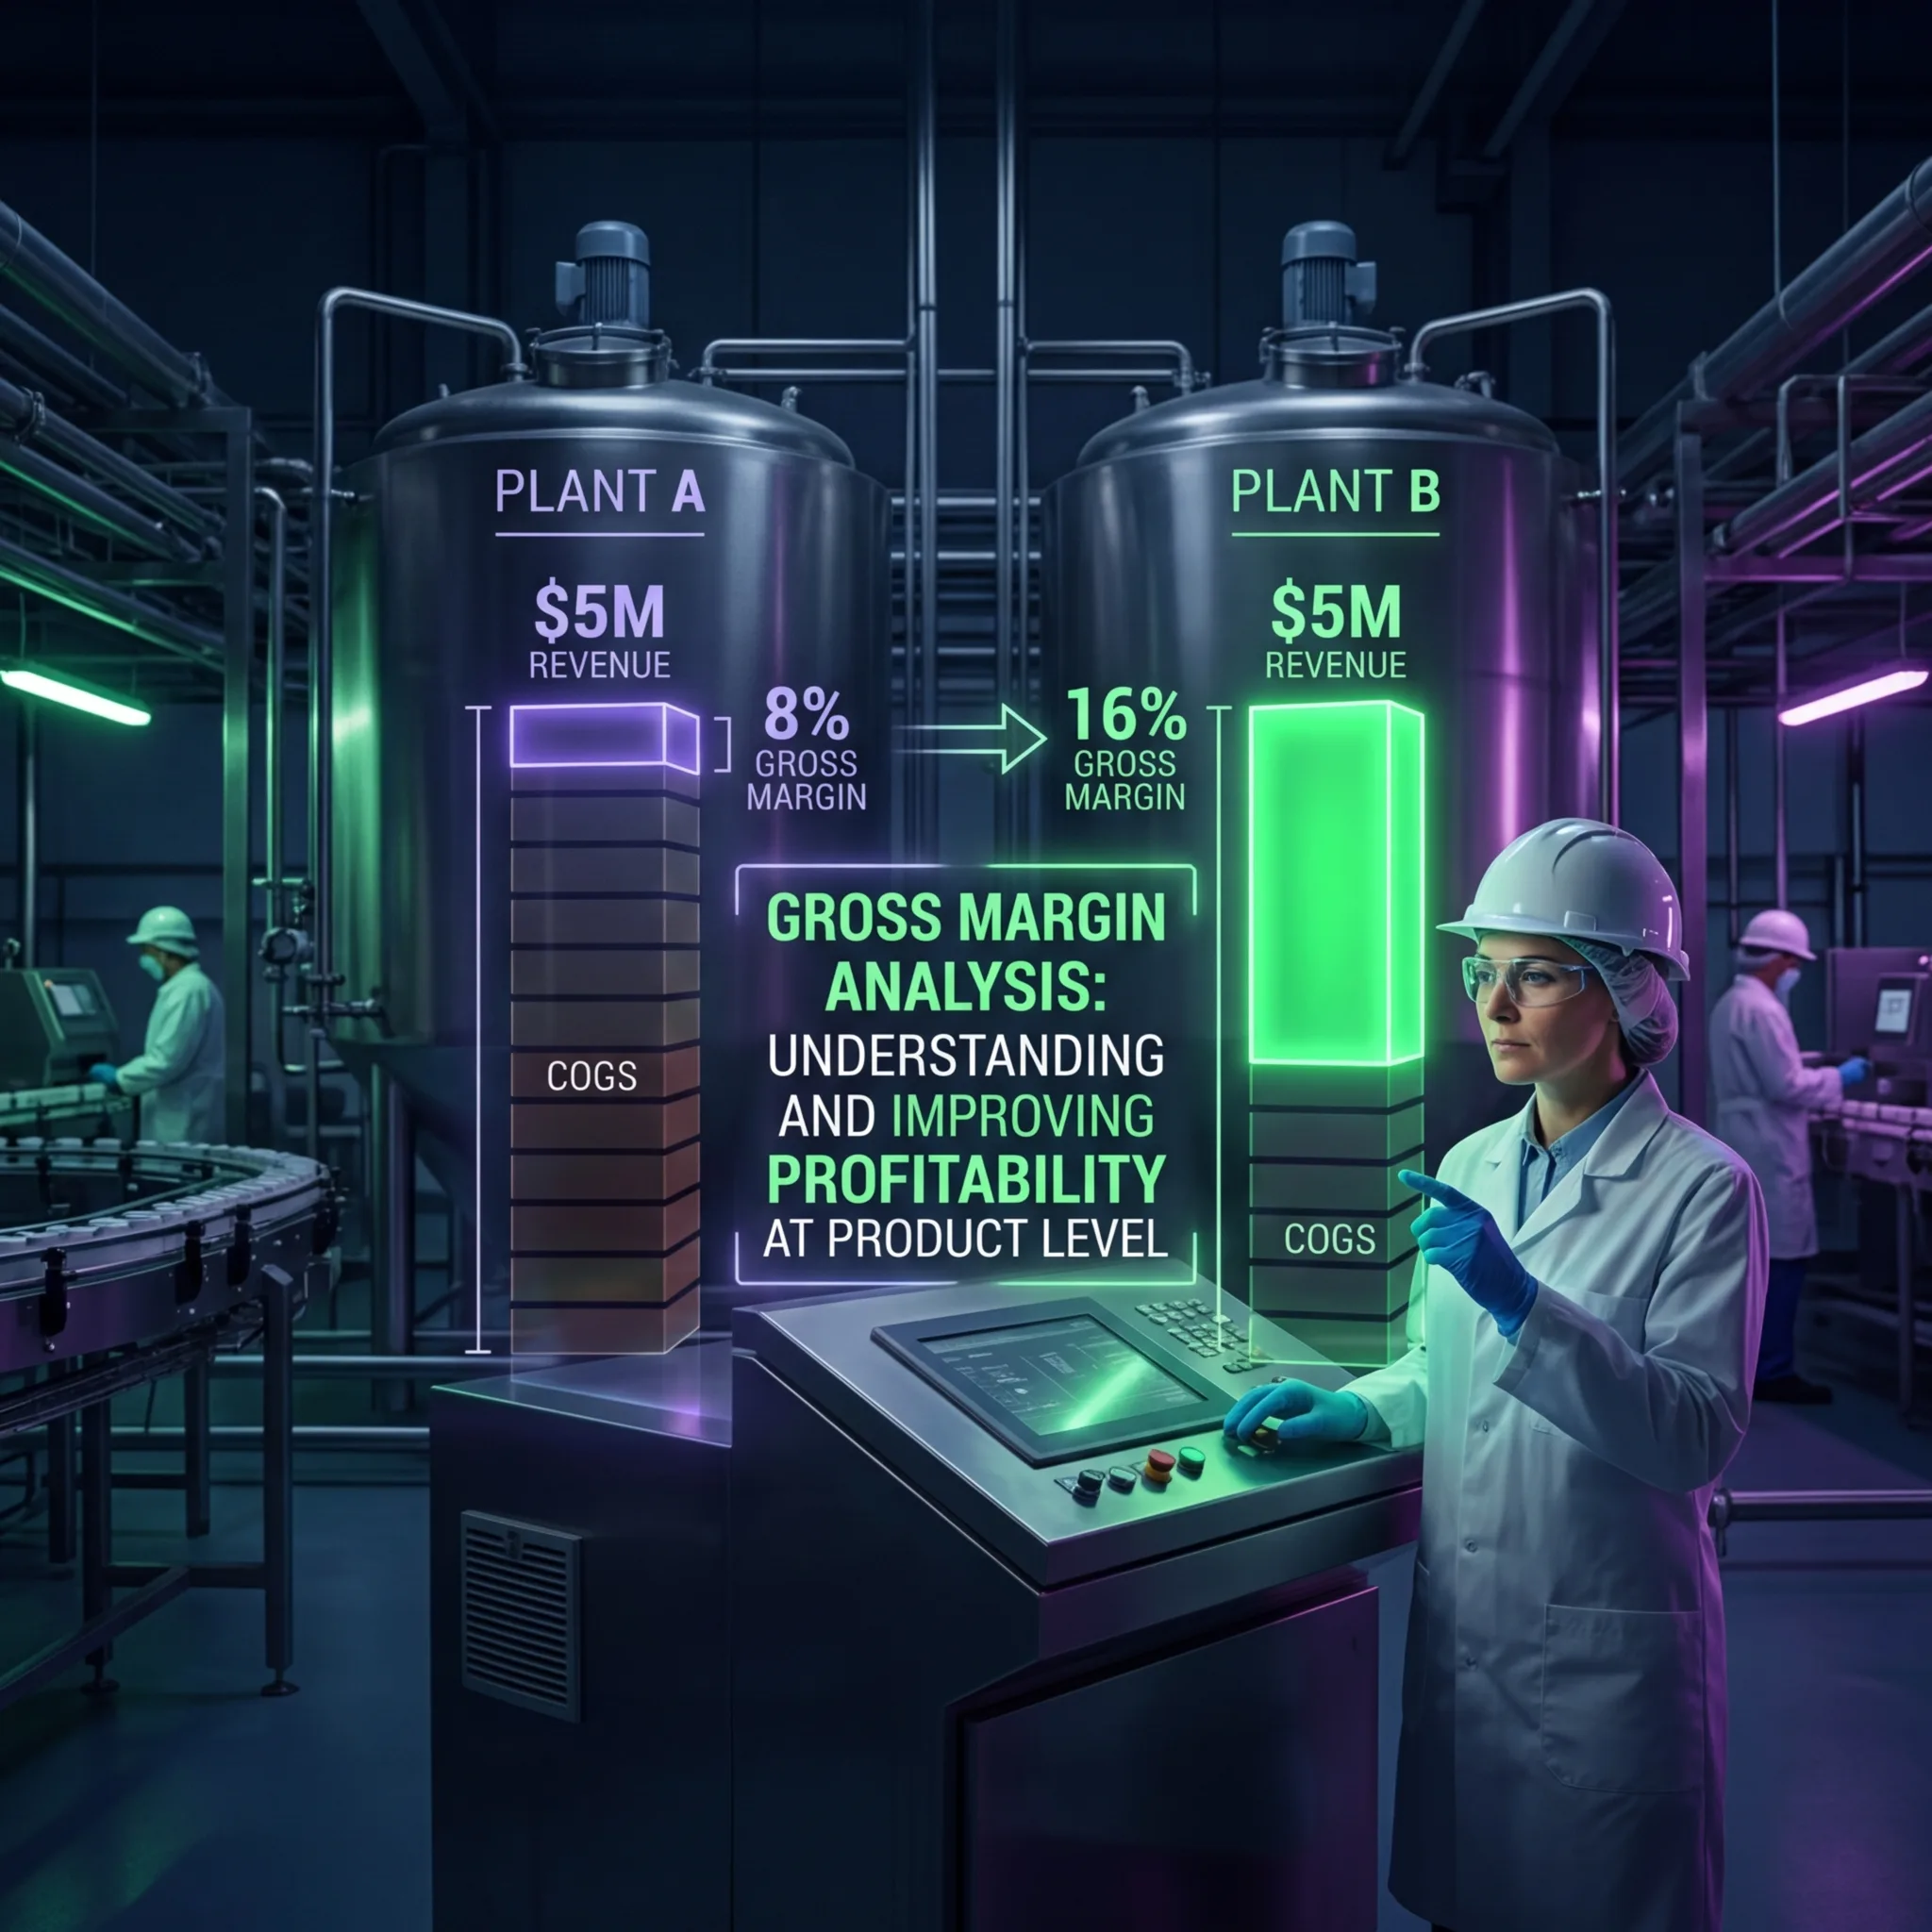
A food manufacturer produces yogurt generating $5M revenue. Management believes it's a profitable product.
Detailed analysis reveals:
- Revenue: $5M
- Direct material cost: $1.8M
- Direct labor: $1.2M
- Equipment depreciation: $600K
- Gross Margin: $400K (8% margin)
vs. competitor with same $5M yogurt revenue generating $800K gross margin (16%). Same market, vastly different profitability.
Gross margin analysis identifies product-level profitability differences enabling strategic decisions.
The Gross Margin Framework
Gross Margin = Revenue - Cost of Goods Sold Gross Margin % = Gross Margin / Revenue
Typical Food Manufacturing Gross Margins:
| Product Category | Typical Margin | High Performance |
|---|---|---|
| Commodity (bulk ingredients) | 15-20% | 22-25% |
| Private label (store brands) | 18-25% | 28-30% |
| Value brands (mid-tier) | 25-35% | 38-42% |
| Premium/specialty | 35-50% | 55-65% |
The Margin Analysis Process
Step 1: Calculate Product-Level Margins
| Product | Revenue | COGS | Gross Margin | Margin % |
|---|---|---|---|---|
| Premium Yogurt | $3M | $1.5M | $1.5M | 50% |
| Value Yogurt | $1.5M | $1.2M | $300K | 20% |
| Bulk Yogurt | $500K | $450K | $50K | 10% |
Step 2: Identify Margin Drivers
For Premium Yogurt (50% margin):
- Product cost: 40% lower than value yogurt (better ingredient sourcing)
- Manufacturing efficiency: 95% OEE vs. 80% for value yogurt
- Pricing: 20% premium due to brand positioning
- Volume: Lower volume, specialized production line
For Value Yogurt (20% margin):
- Higher material cost (less efficient sourcing due to smaller volume)
- Manufacturing inefficiency: More downtime, changeovers
- Pricing: Standard market rate
- Volume: Higher but insufficient to achieve efficiency
Step 3: Strategic Implications
Low-margin products require attention:
- Price increase potential? (No—commodity priced competitively)
- Cost reduction opportunity? (Yes—better sourcing, efficiency)
- Exit decision? (Consider if cost reduction insufficient)
High-margin products merit investment:
- Increase production/marketing investment
- Expand product line extensions
- Build brand equity supporting premium positioning
Improving Gross Margin
Margin Improvement Levers:
-
Price Increase (if sustainable):
- 5% price increase on $3M premium product = $150K additional margin
- Risk: Demand elasticity (customers may switch)
- Opportunity: Only if differentiation justifies
-
Cost Reduction:
- Direct material: Negotiate better supplier rates (5% = $75K)
- Direct labor: Improve efficiency/automation (5% = $60K)
- Depreciation: Already allocated; reduce through higher volume
- Total potential: $135K improvement
-
Product Mix Shift:
- If premium margin 50%, value margin 20%
- Shift 20% of value volume to premium = margin improvement
- $300K value margin x 20% + $500K premium margin x 20% delta = $140K improvement
The Valuation Impact
Two yogurt manufacturers with same $5M revenue:
- Manufacturer A: 20% gross margin ($1M) = likely valued at 4-5x EBITDA
- Manufacturer B: 35% gross margin ($1.75M) = likely valued at 6-7x EBITDA
The gross margin difference impacts valuation multiples due to perceived operational excellence and profitability quality.
For food manufacturing companies, systematic gross margin analysis by product identifies profitability opportunities while informing product portfolio strategy.