A food manufacturer builds an annual budget in December: Projects $50M revenue, 20% EBITDA margin for the coming year.
By March, actual performance is $13M (vs. $12.5M budget), but the annual plan is already stale. Actual market conditions differ from December predictions. The annual budget lacks relevance.
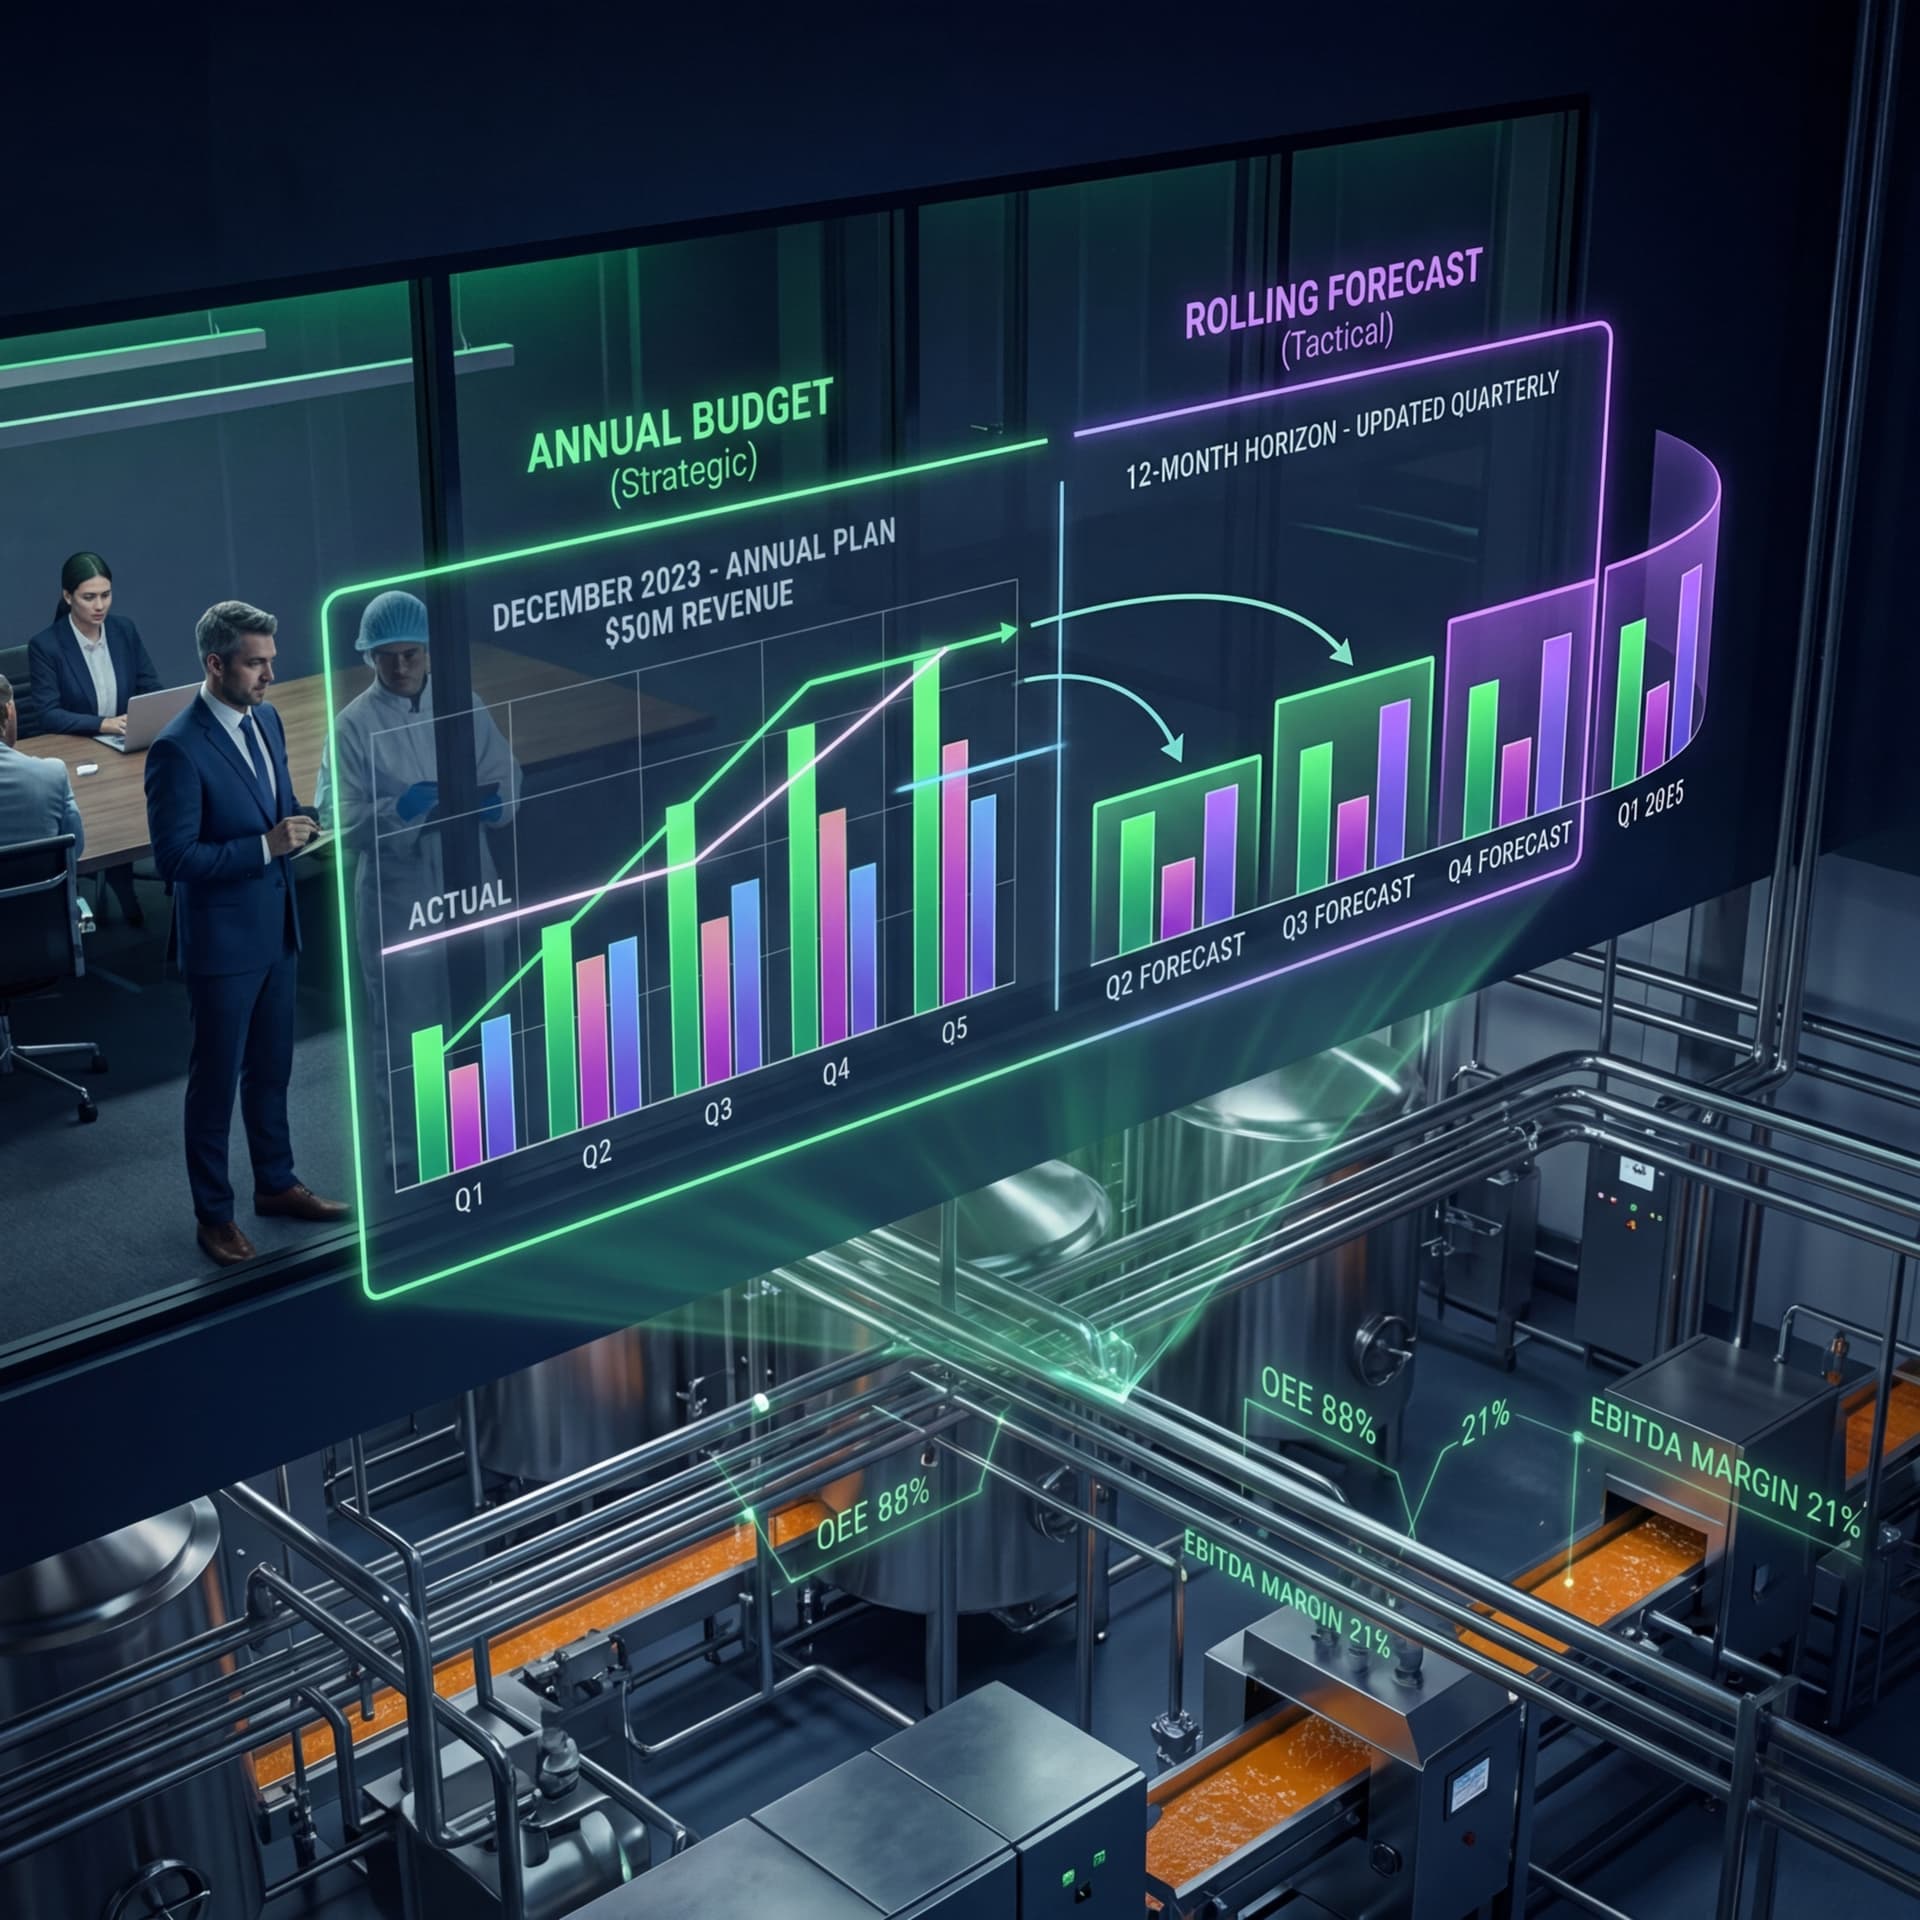
Progressive manufacturers combine annual budgets with rolling quarterly forecasts—maintaining directional guidance while updating near-term visibility.
The Dual Planning Approach
Annual Budget (Strategic)
- Built December/January with 12-month horizon
- Financial plan aligned to strategic objectives
- Detailed P&L and balance sheet projections
- Used for board communication and PE investor reporting
- Updated annually (occasional mid-year adjustments)
Rolling Quarterly Forecast (Tactical)
- Updated monthly with new actual results
- 12-month rolling horizon (always 4 quarters forward)
- Reflects actual market conditions and updated assumptions
- Used for operational decisions and cash management
- More accurate than original budget (based on 3+ months actuals)
The Planning Calendar
| Month | Budget/Forecast Activity |
|---|---|
| December | Build annual budget for next year |
| January | Finalize budget; board approval |
| February | Close January; build monthly forecast (Feb-May) |
| March | Close February; update forecast (Mar-Jun); reforecast full year |
| April | Close March; update forecast (Apr-Jul) |
| Quarterly | Full quarterly review; reforecast rolling 12 months |
Budget vs. Forecast Comparison
| Metric | Annual Budget | Q1 Forecast | Q2 Forecast | Actual |
|---|---|---|---|---|
| Revenue | $50M | $50M | $48.5M | $48.5M |
| EBITDA | $10M | $10M | $8.5M | $8.5M |
| EBITDA % | 20% | 20% | 17.5% | 17.5% |
The rolling forecast "sees" Q2 challenges earlier than annual budget, enabling faster corrective action.
Building the Annual Budget
Step 1: Strategic Assumptions (November)
- Macro assumptions (inflation, interest rates, currency)
- Market assumptions (customer growth/loss, price trends)
- Operational assumptions (efficiency improvements, capacity)
Step 2: Revenue Planning (December)
- Customer-by-customer forecast for top customers
- Segment forecasts (product lines, channels)
- New customer acquisition targets
Step 3: Expense Planning (December)
- Gross margin targets (COGS reduction initiatives)
- SG&A budget (headcount, marketing spend)
- Capital expenditure plan
Step 4: Approval (January)
- Management review and alignment
- Board approval
- Communicate to organization
Rolling Forecast Process
Monthly Process:
- Close prior month actuals (by 10th of month)
- Update assumptions (market, customer, operational)
- Reforecast revenue and expenses
- Evaluate variance vs. budget and prior forecast
- Report to management and board
Quarterly Deep Dive:
- Reforecast full 12 months
- Update strategic assumptions
- Evaluate variances and root causes
- Plan corrective actions if needed
Variance Analysis and Escalation
At Budget Level (Annual):
- Q2 actual EBITDA $8.5M vs. $10M plan = -15% variance
- Investigation: Gross margin -2% + SG&A +2% of revenue
- Action: Full-year reforecast; board communication
At Forecast Level (Monthly):
- Q2 reforecast EBITDA $8.5M vs. $9M February forecast = -5.6% variance
- Investigation: Specific customer revenue shortfall + material cost increase
- Action: Weekly tracking; 30-day corrective action plan
The Financial Impact
Effective budget/forecast management:
- Reduces EBITDA surprise to under 5% vs. budget (vs. 10%+ without process)
- Enables 4-6 week earlier course correction
- Improves cash management (accurate liquidity planning)
- Increases management credibility with PE investors
For food manufacturing companies, combining annual budgets with rolling forecasts balances strategic planning with tactical flexibility enabling effective financial management.