Food manufacturer CFO asks: "How do we create value for PE investor over 5-year hold?"
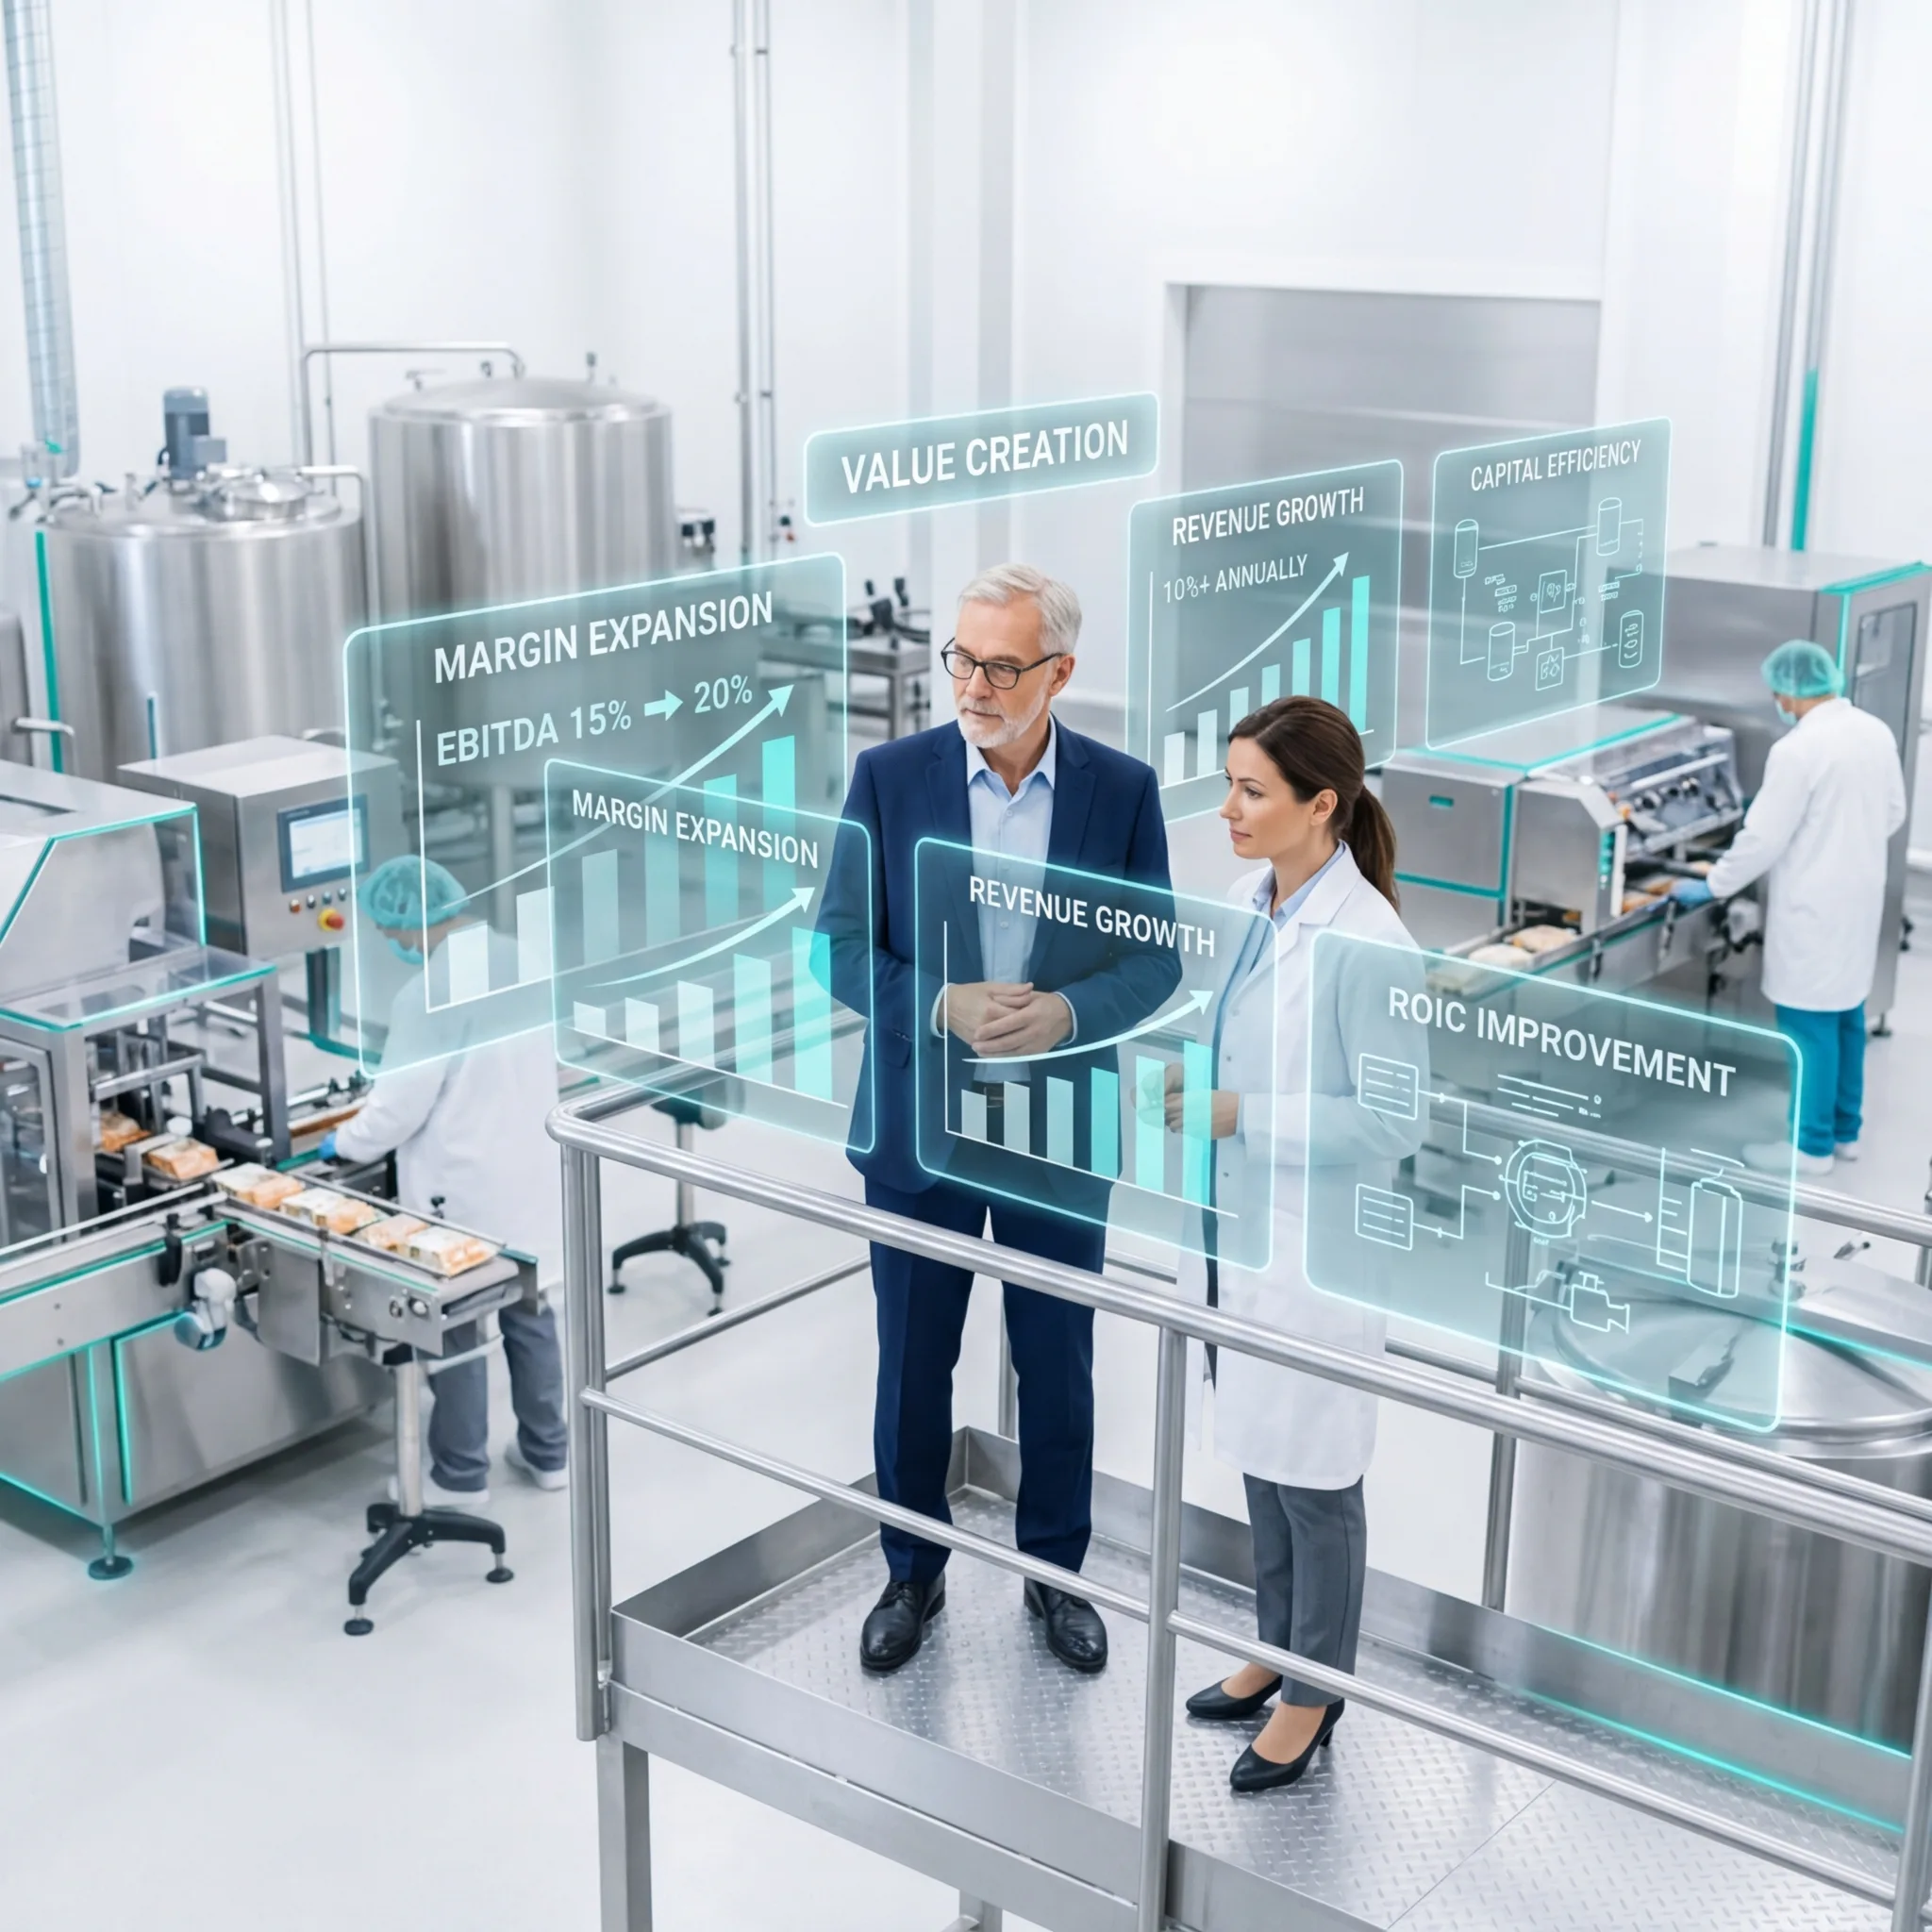
Answer: Three levers drive enterprise value creation:
- Margin Expansion: EBITDA margin improvement (15% to 20%)
- Revenue Growth: Top-line growth (10%+ annually)
- Capital Efficiency: ROIC improvement and working capital optimization
The Value Creation Framework
Enterprise Value Formula:
EV = (Revenue x EBITDA Margin x Multiple) - Net Debt
Example: $50M revenue manufacturer
Year 1 (Entry):
- Revenue: $50M
- EBITDA margin: 15% = $7.5M EBITDA
- Multiple: 5.0x EBITDA
- Gross EV: $37.5M
- Less: Net debt $15M
- Equity value: $22.5M
Year 5 (Target):
- Revenue: $100M (+100%)
- EBITDA margin: 20% (+5%) = $20M EBITDA
- Multiple: 6.5x (improved quality) = $130M
- Less: Net debt $5M (deleveraged)
- Equity value: $125M
Value Creation: $22.5M to $125M = $102.5M (4.6x equity multiple)
Lever 1: Margin Expansion
Key Drivers:
| Initiative | Current | Target | Impact |
|---|---|---|---|
| Gross margin | 40% | 44% | +$2M on $50M revenue |
| SG&A % | 18% | 15% | +$1.5M |
| EBITDA margin | 15% | 20% | +$2.5M |
Tactics:
- Product mix shift to premium products (+2-3% gross margin)
- Operational efficiency (lean, automation, OEE) (-2-3% SG&A)
- Procurement optimization (+0.5-1% gross margin)
- Fixed cost absorption through growth
- Revenue synergies from M&A
Financial Impact: 5% margin expansion on $100M revenue = $5M additional EBITDA = $32.5M additional EV (at 6.5x multiple)
Lever 2: Revenue Growth
Growth Drivers:
| Strategy | Year 1 | Year 2 | Year 3 | CAGR |
|---|---|---|---|---|
| Organic growth | 8% | 9% | 10% | 9% |
| Acquisition Year 2 | -- | $15M | -- | -- |
| Combined | 8% | 35% | 8% | 15% |
Tactics:
- New product innovation (5+ annually)
- Geographic expansion (new states, regions)
- Customer acquisition (new accounts)
- Market share gains (from competitors)
- Strategic acquisitions (consolidation, bolt-on)
Financial Impact: $50M to $100M revenue = $50M revenue growth. At 18% EBITDA margin = $9M incremental EBITDA = $58.5M additional EV
Lever 3: Capital Efficiency (ROIC/Deleverage)
Working Capital Optimization:
| Metric | Current | Target | Impact |
|---|---|---|---|
| Days inventory | 45 days | 35 days | -$2.5M cash tied up |
| Days A/R | 30 days | 28 days | -$0.3M |
| Days A/P | 30 days | 35 days | +$0.8M |
| Net working capital benefit | -- | -- | -$1M cash use |
Capital Investment Discipline:
- ROI threshold: 20%+ for organic capex
- M&A: 3-year payback or better
- Reduce capex intensity through efficiency gains
- Deleverage: Use FCF to pay down debt
Financial Impact:
- Working capital optimization: $1-2M cash freed up
- Lower leverage (3x to 2x) reduces risk premium
- Multiple expansion potential (5.0x to 6.5x) from lower risk
Value Creation Summary
| Lever | $M EBITDA Impact | Multiple Impact | EV Impact |
|---|---|---|---|
| Margin (15% to 20%) | +$5M | -- | +$32.5M |
| Growth ($50M to $100M) | +$9M | -- | +$58.5M |
| ROIC/Quality | -- | +1.5x | +$15M |
| Capital efficiency | -- | -- | -- |
| Total | +$14M | +1.5x | +$106M |
Total Value Creation: $22.5M to $125M (5.6x equity multiple)
PE Value Creation Priorities
Year 1-2: Stabilize operations, margin expansion, quick wins Year 2-3: Growth acceleration, acquisitions, operational leverage Year 3-5: Exit preparation, multiple expansion, value realization
For food manufacturing companies, systematic focus on three value creation levers (margin, growth, capital efficiency) drives substantial enterprise value creation attractive to PE investors.