A food processing facility (100 tons/day throughput) operates with conventional equipment: Steam boilers, cooling towers, constant-temperature equipment, frequent water washing. Result: $80K monthly energy costs, $40K monthly water costs. High carbon footprint. ESG compliance challenged.
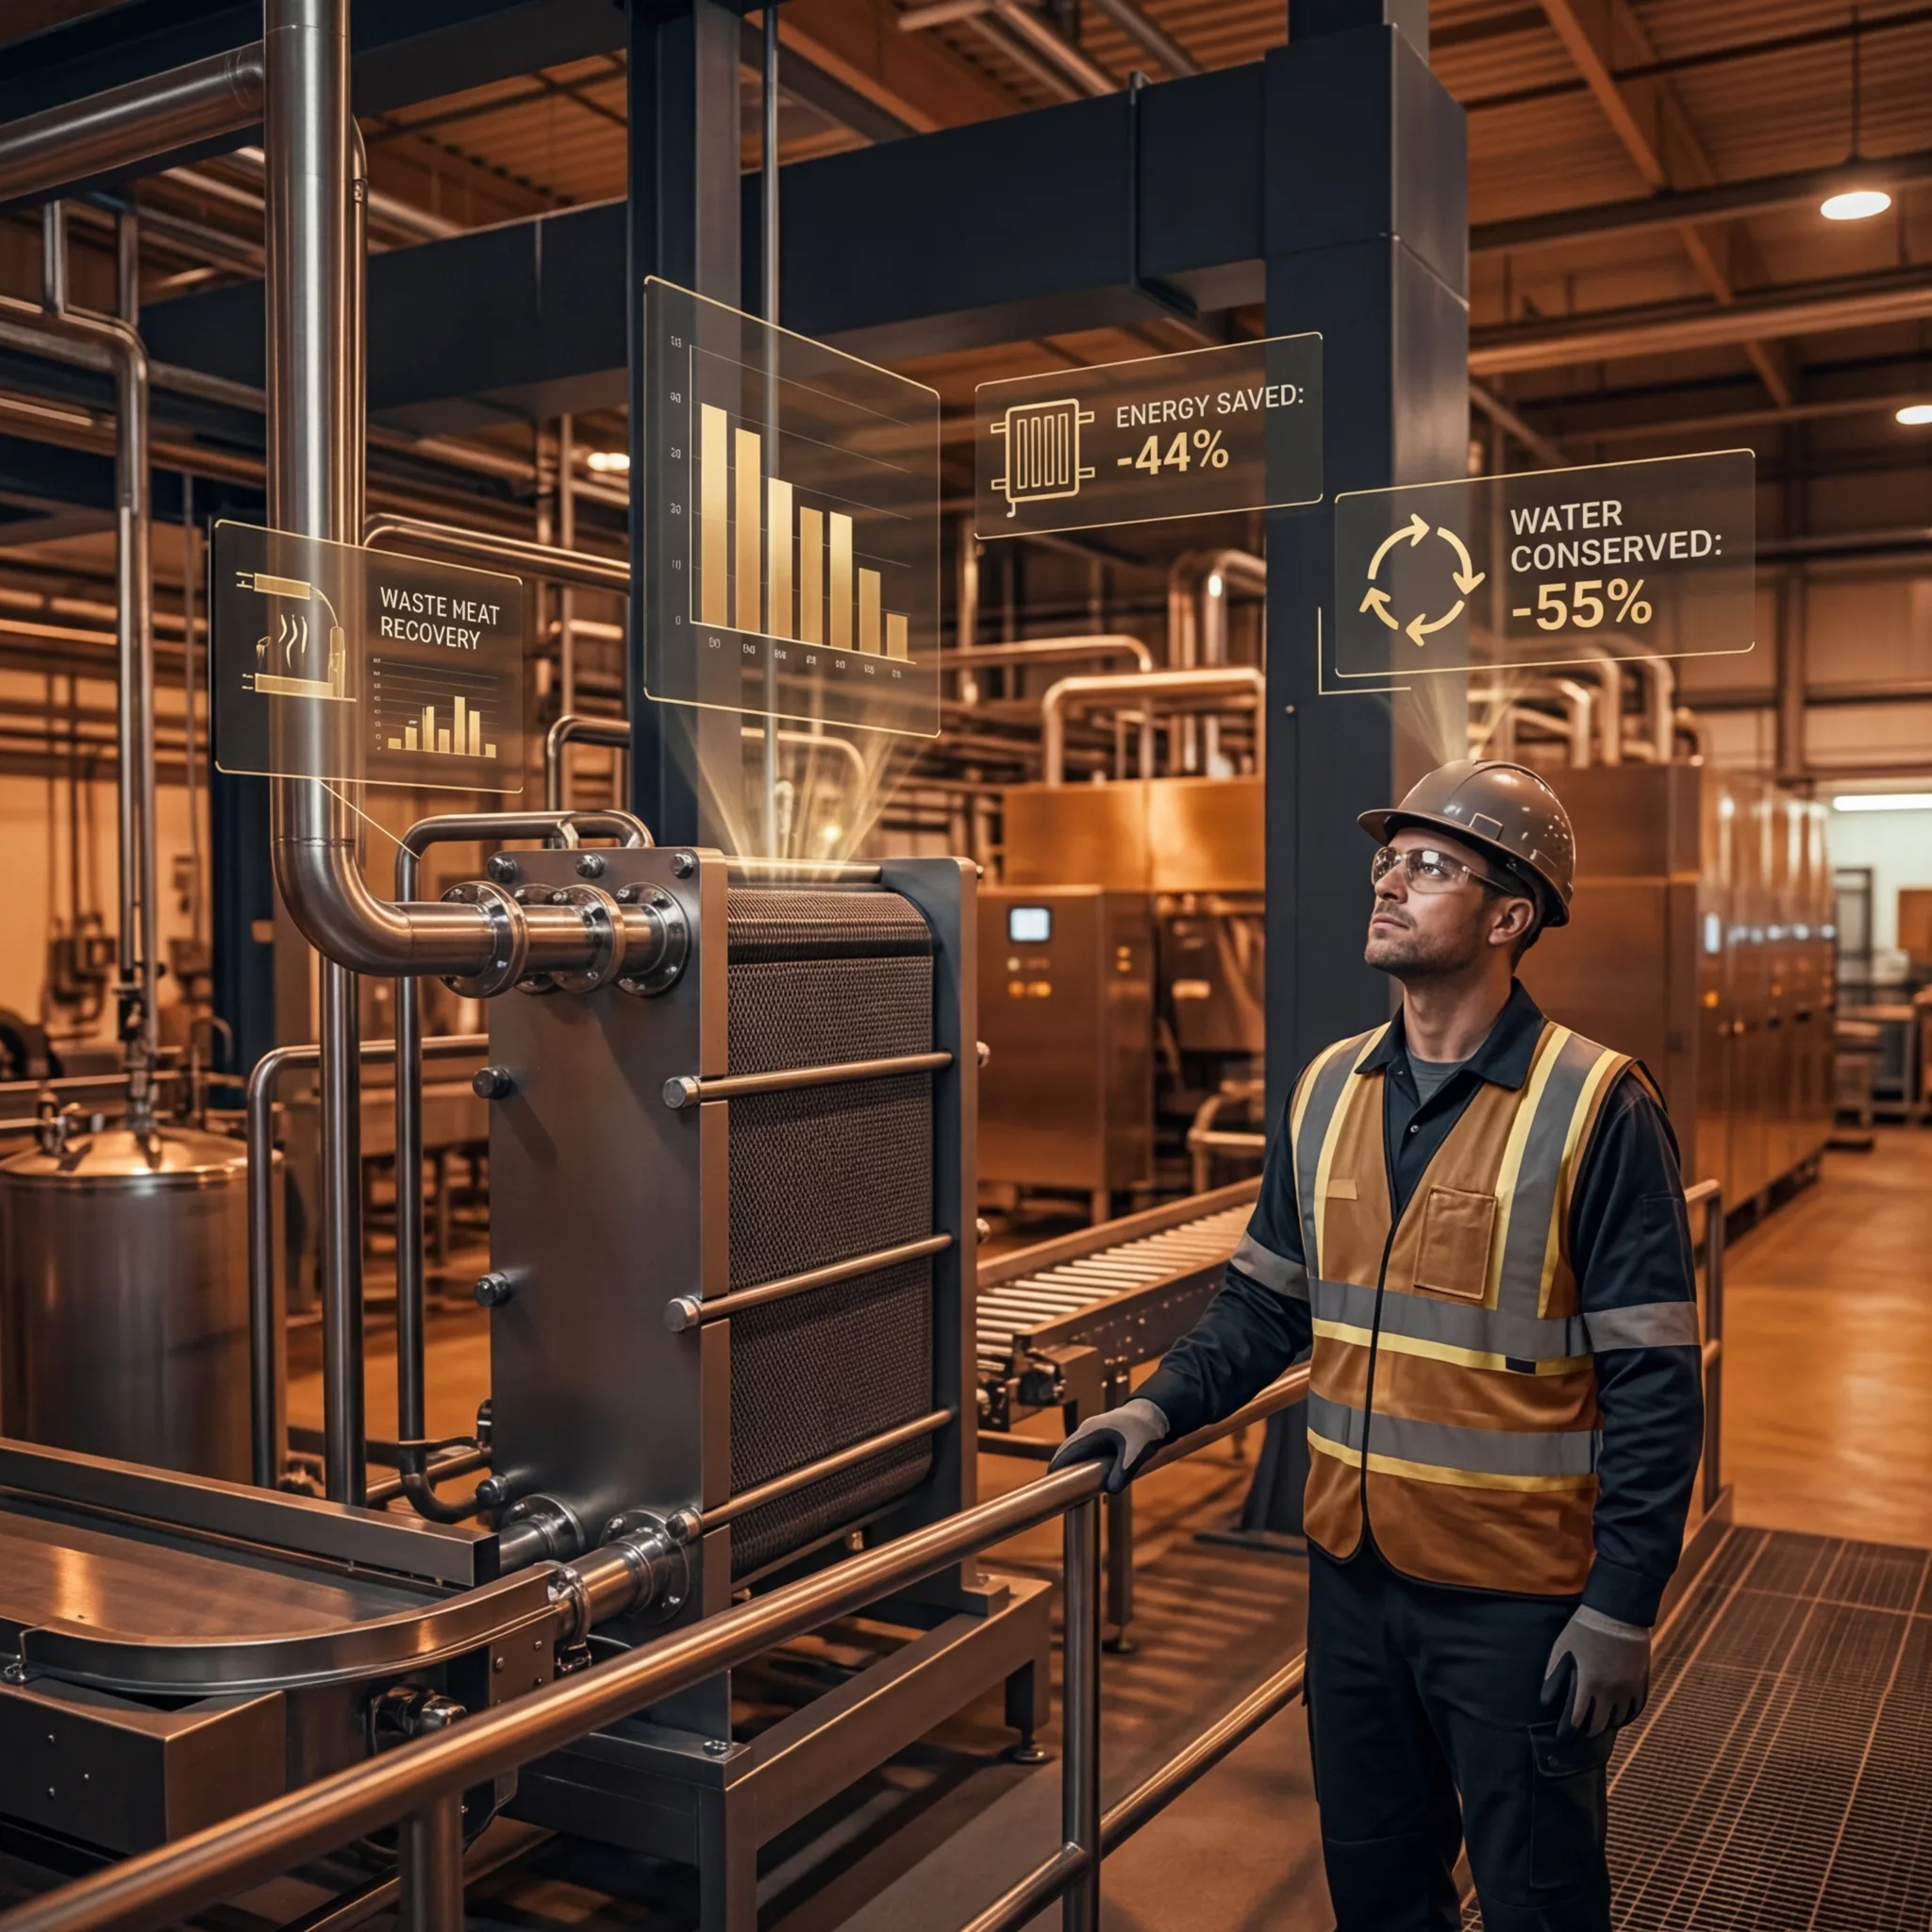
A modern facility installs efficiency upgrades: Plate heat exchangers (recover waste heat), LED lighting, direct steam injection, closed-loop cooling, dry cleaning between products. Result: $45K monthly energy costs (-44%), $18K monthly water costs (-55%). Annual savings: $480K. Carbon footprint reduced 50%. ESG goals exceeded.
Sustainable processing directly impacts operating costs and environmental responsibility.
The Sustainability Framework
Financial + Environmental:
Cost reduction = Environmental improvement
- Less energy consumption = Lower carbon footprint
- Less water usage = Lower environmental impact
- Waste reduction = Lower disposal costs
- Triple benefit: Economics, environment, reputation
Energy Efficiency Opportunities
1. Heat Recovery (Plate Heat Exchangers)
Current: Steam cooling water discarded (heat wasted) Improvement: Use steam heat to pre-warm incoming product water
Example:
- Pre-pasteurization cooling: 90C to 40C
- Waste heat: 50C temperature difference
- Heat recovery: Pre-warm incoming water (ambient 20C to 50C)
- Result: Heating requirement reduced 75%
Savings: 30-50 kW reduction in boiler demand Annual cost: -$20-50K per heat exchanger Capital: $50-100K equipment Payback: 1-3 years
2. LED Lighting vs. Incandescent
Current: Incandescent/fluorescent facility lighting Improvement: LED lighting throughout
Savings: 70% energy reduction Example (100 tons/day facility):
- Lighting energy: 30 kW incandescent
- LED replacement: 9 kW
- Reduction: 21 kW
- Annual savings: $15-20K
Capital: $30-50K facility retrofit Payback: 2-3 years
3. Direct Steam Injection
Current: Steam-jacketed kettles (inefficient heating) Improvement: Direct steam injection into product
Advantage:
- Steam condenses in product (releases latent heat)
- 100% heat transfer (no wall loss)
- Rapid heating (5-15 min vs. 30-60 min)
Savings: 20-30% heating energy reduction Additional benefit: Reduced process time = Increased throughput
4. Variable Frequency Drives (VFD)
Current: Constant-speed motors (pump, fan at full speed always) Improvement: VFD adjusts motor speed to demand
Savings: 25-40% motor energy reduction Example: 50 kW compressor
- Full speed constant: 50 kW
- VFD optimization: 30 kW average
- Reduction: 20 kW
- Annual savings: $15-25K
Capital: $10-20K VFD installation Payback: Under 1 year
5. Improved Insulation
Current: Standard insulation (R-10 to R-15) Improvement: Enhanced insulation (R-25 to R-30)
Savings: 10-15% thermal loss reduction Application: Refrigeration rooms, heated tanks, pipes
Annual savings: $5-10K per room/system Capital: $5-20K installation Payback: 1-2 years
Water Conservation Opportunities
1. Closed-Loop Cooling
Current: Cooling tower drains water continuously (replacement) Improvement: Recirculate cooling water, treat and reuse
Water Savings: 80-90% reduction in cooling water consumption Example (100 tons/day facility):
- Cooling demand: 500 gallons/minute
- Closed-loop savings: 400-450 gal/min
- Daily reduction: 600,000-700,000 gallons
- Annual savings: $50-100K water cost
Capital: $100-200K treatment/recirculation system Payback: 1-2 years
2. Wastewater Recycling
Current: Wastewater disposal (sewer charges) Improvement: Treat wastewater, reuse for cleaning
Application: Washdown water for non-food areas, cleaning floors Savings: 30-50% wastewater disposal cost reduction Example: $40K annual wastewater reduced to $15-25K (70% reduction possible)
Capital: $50-150K treatment system Payback: 2-4 years (depending on tipping fees)
3. Dry Cleaning
Current: Wet cleaning between product runs (high water use) Improvement: Dry cleaning (sweeping, vacuuming) before wet cleaning
Benefit: 30-50% water reduction in cleaning operations Example: 10 product changes/day x 200 gallons each = 2,000 gallons/day
- Dry cleaning first: Reduces to 1,000-1,400 gallons/day
- Reduction: 600-1,000 gallons/day
- Annual savings: $20-40K
Capital: Minimal (equipment purchase: $5-10K) Payback: Under 1 year
Implementation Example: 100-Ton/Day Facility
Current State:
- Energy: $80K monthly, 2,000 kW demand
- Water: $40K monthly, 2 million gallons/day
- Carbon: 15,000 tons CO2/year
Improvements Implemented:
-
Heat recovery: -40 kW (-$20K annual)
-
LED lighting: -21 kW (-$15K annual)
-
Direct steam: -30 kW (-$20K annual)
-
VFD motors: -20 kW (-$15K annual)
-
Better insulation: -8 kW (-$5K annual)
-
Subtotal energy: -$75K annual (-40%)
-
Closed-loop cooling: -400 gal/min (-$50K annual)
-
Wastewater recycling: (-$15K annual)
-
Dry cleaning: -600 gal/day (-$20K annual)
-
Subtotal water: -$85K annual (-53%)
Total Annual Savings: $160K
Total Capital Investment: $350K Payback Period: 2.2 years
Carbon Reduction: 50% (~7,500 tons CO2/year)
Non-Financial Benefits
- ESG compliance (major corporations require)
- Brand reputation (sustainability leadership)
- Regulatory compliance (emerging standards)
- Employee morale (sustainability focus)
- Investor confidence (ESG scores improved)
Cost-Benefit Summary
| Factor | Impact |
|---|---|
| Energy savings | $75K annually typical |
| Water savings | $85K annually typical |
| Total annual savings | $160K typical |
| Capital investment | $250-350K typical |
| Payback period | 1.5-2.5 years |
| Carbon reduction | 40-50% typical |
| ESG improvement | Significant |
For all food manufacturers, sustainable processing optimization delivers immediate cost reduction, environmental responsibility, and ESG compliance.