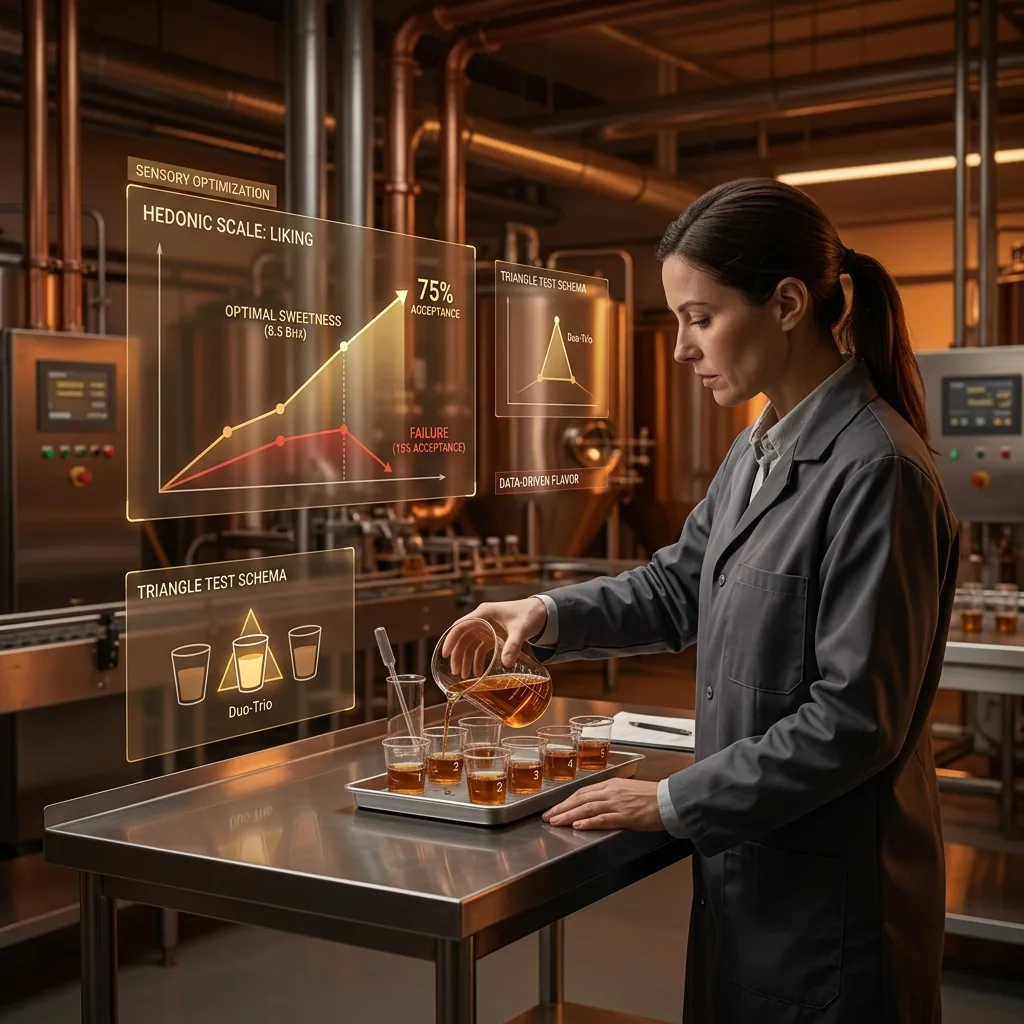
A beverage company launches new flavor without consumer testing. Result: Product launched, 15% market acceptance (failure threshold), discontinued after 6 months, $2M loss.
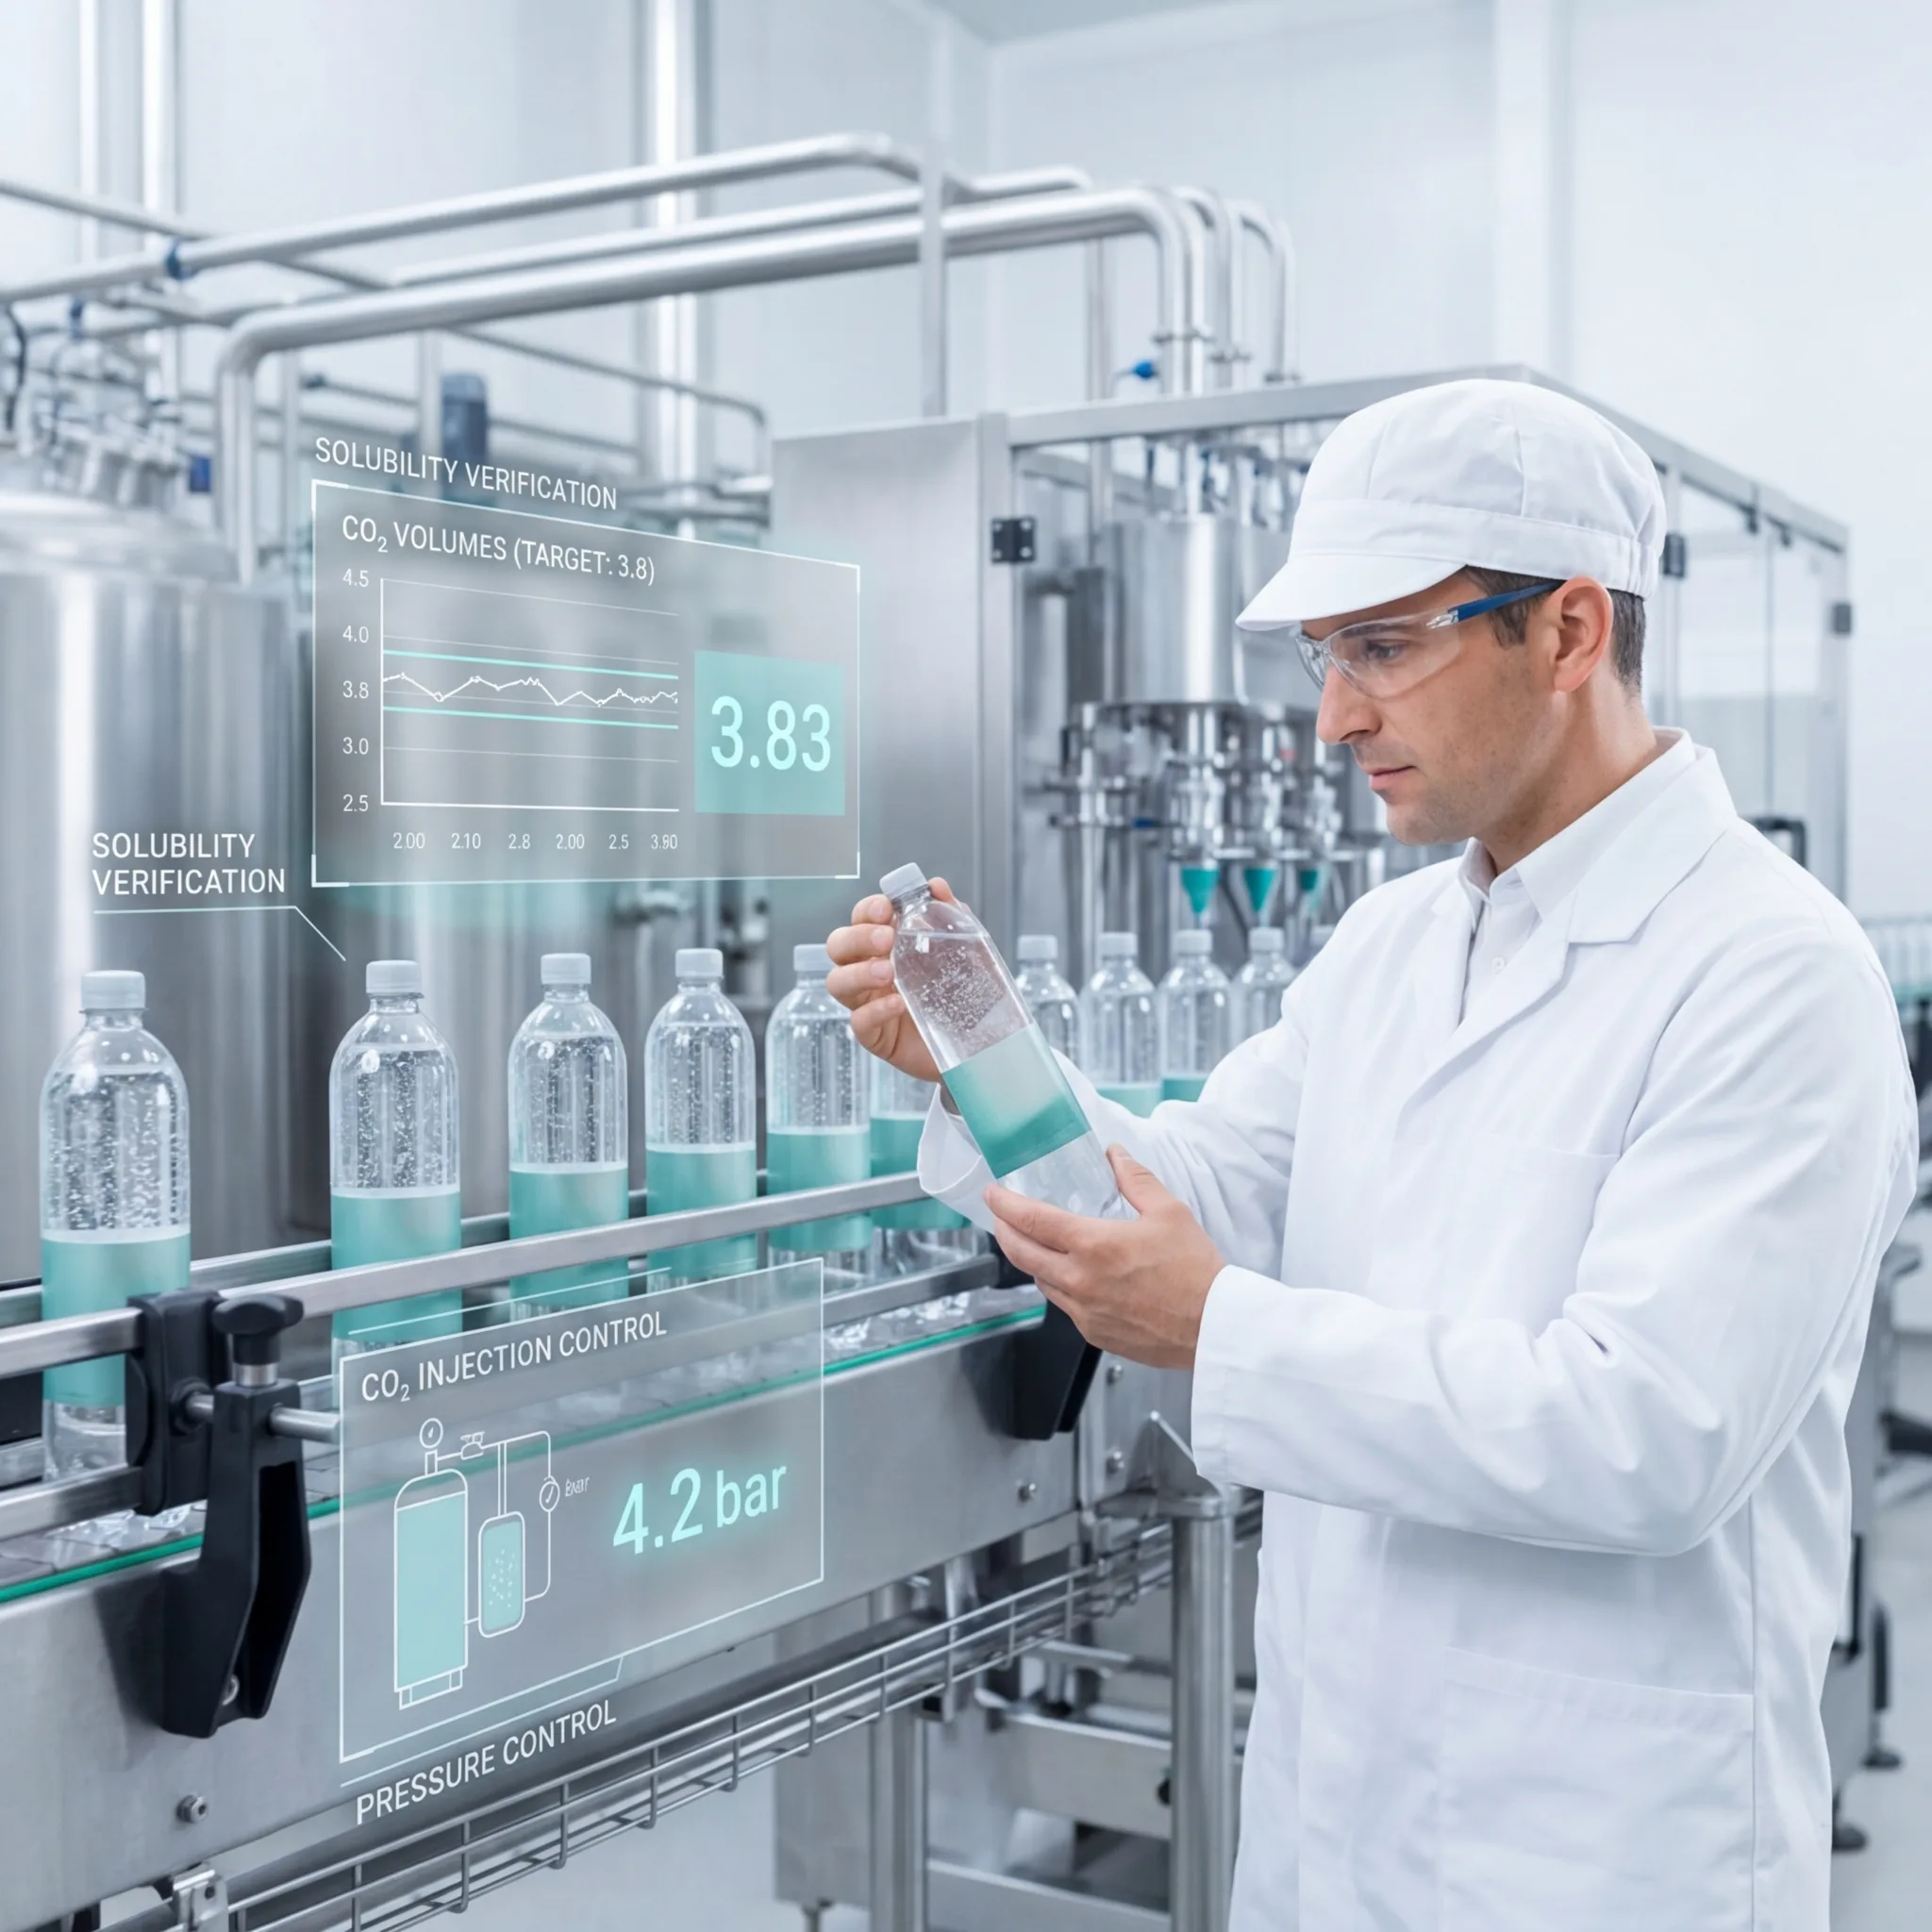
A data-driven company conducts sensory panels (n=200 consumers), tests sweetness (5-12% range), identifies optimal 8.5 Brix. Result: 75% consumer acceptance (success threshold), successful 3-year product run, $15M revenue generated.
Sensory science directly impacts product success and consumer loyalty.
The Sensory Science Framework
Sensory Methods:
Three primary categories:
- Discrimination Testing: Detect differences between samples
- Descriptive Analysis: Profile sensory attributes
- Preference/Acceptance Testing: Consumer liking scores
Method 1: Discrimination Testing
Triangle Test:
Principle: Detect if samples differ
Process:
- Samples: 3 provided (2 identical, 1 different)
- Task: Identify which one differs
- Panelists: 30-50 untrained consumers
- Threshold: 50% or more correct identifies difference (statistical)
Application: Detect process changes, new ingredient effects
Duo-Trio Test:
Similar principle: Reference + 2 unknowns (one matches reference)
- Identify: Which unknown matches reference?
- Sensitivity: Similar to triangle test
Method 2: Descriptive Analysis (Quantitative Descriptive Analysis - QDA)
Purpose: Profile sensory attributes quantitatively
Process:
- Train Panel: 10-20 trained panelists (15-20 hours training)
- Define Attributes: e.g., sweetness, sourness, bitterness, aroma
- Measure: Each attribute on 0-10 scale (intensity)
- Result: Detailed sensory profile
Example (Yogurt QDA):
| Attribute | Scale | Result |
|---|---|---|
| Sweetness | 0-10 | 7.2 |
| Sourness | 0-10 | 4.8 |
| Creaminess | 0-10 | 8.1 |
| Vanilla aroma | 0-10 | 6.4 |
| Texture (smooth) | 0-10 | 8.5 |
Advantage: Objective, reproducible, identifies specific drivers
Method 3: Preference Testing (Consumer Acceptance)
Hedonic Scale (Most Common):
9-point scale from "Dislike extremely" to "Like extremely"
| Score | Descriptor |
|---|---|
| 1 | Dislike extremely |
| 2 | Dislike very much |
| 3 | Dislike moderately |
| 4 | Dislike slightly |
| 5 | Neither like nor dislike |
| 6 | Like slightly |
| 7 | Like moderately |
| 8 | Like very much |
| 9 | Like extremely |
Scoring:
- Scores 1-3: Dislike (unacceptable)
- Scores 4-6: Neutral-acceptable (marginal)
- Scores 7-9: Like (acceptable/successful)
- Target: Mean score of 6.5 or higher (75%+ acceptance typical)
Sample Size: 100-300 consumers (representative)
Formulation Optimization Study Example
Objective: Optimize sweetness in new beverage
Variables Tested: Sweetness level (5%, 7%, 8%, 9%, 10%, 11%, 12% sugar)
Methodology:
- Test Samples: 7 variations (different sweetness levels)
- Panelists: 200 consumers (untrained, representative)
- Method: Hedonic scale (1-9)
- Design: Blind evaluation (no brand bias)
Results:
| Sweetness % | Mean Liking | Acceptance % |
|---|---|---|
| 5% | 5.2 | 45% |
| 7% | 6.1 | 62% |
| 8% | 7.3 | 78% |
| 9% | 7.1 | 74% |
| 10% | 6.8 | 68% |
| 12% | 5.5 | 48% |
Finding: 8% sweetness optimal (highest liking score)
Statistical Analysis
ANOVA (Analysis of Variance):
Tests if differences between samples are statistically significant
- Result: F-value, p-value
- Threshold: p value under 0.05 (significant difference)
- Determines: Which formulations truly differ
Example: Samples at 7%, 8%, 9% sweetness differ significantly (p value under 0.01)
Cost-Benefit Analysis
| Factor | Cost/Impact |
|---|---|
| Study design | $2-5K |
| Panel recruitment | $2-5K (200 panelists) |
| Sample prep | $1-3K |
| Data analysis | $1-2K |
| Total cost | $6-15K |
| Failed launch prevented | $1-10M+ savings |
| Success rate improvement | 15% to 75% acceptance |
| ROI | 100-1,000x |
For product developers, sensory science is essential pre-launch de-risking.