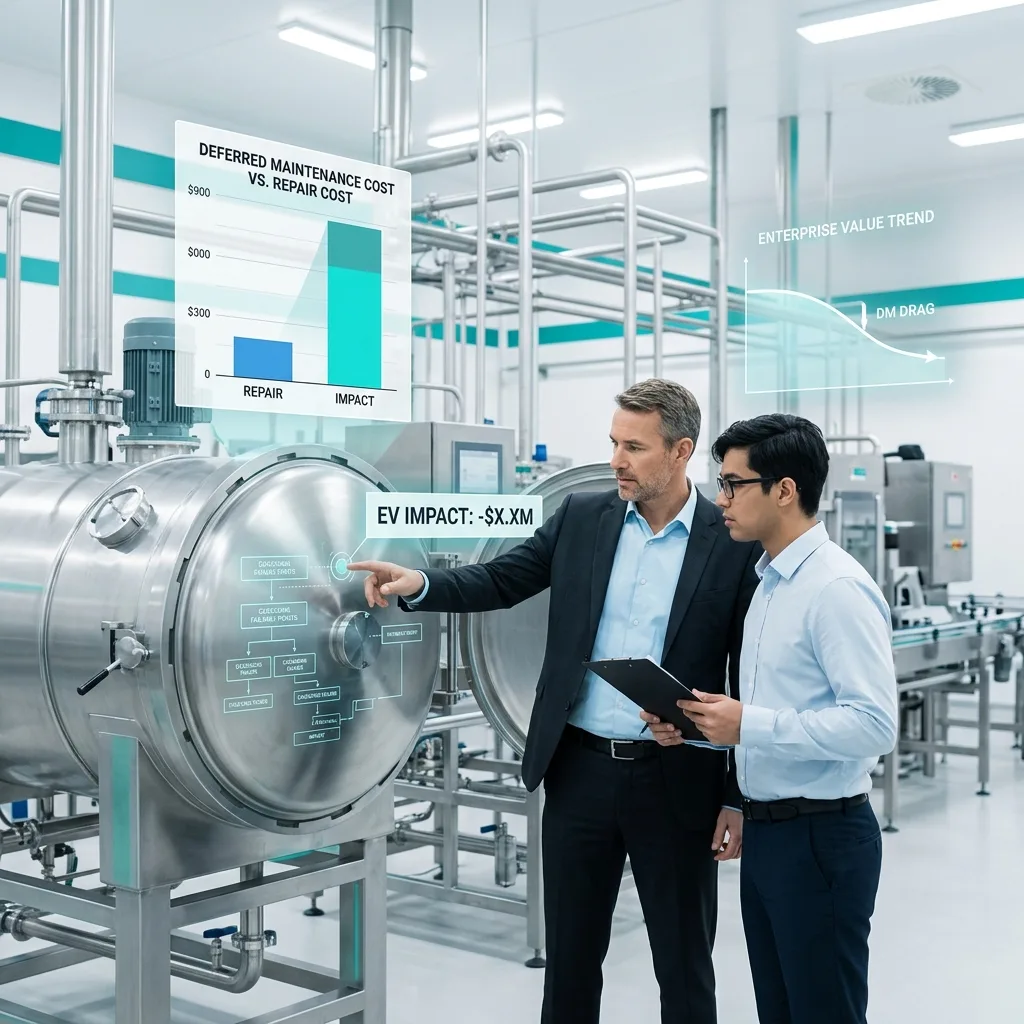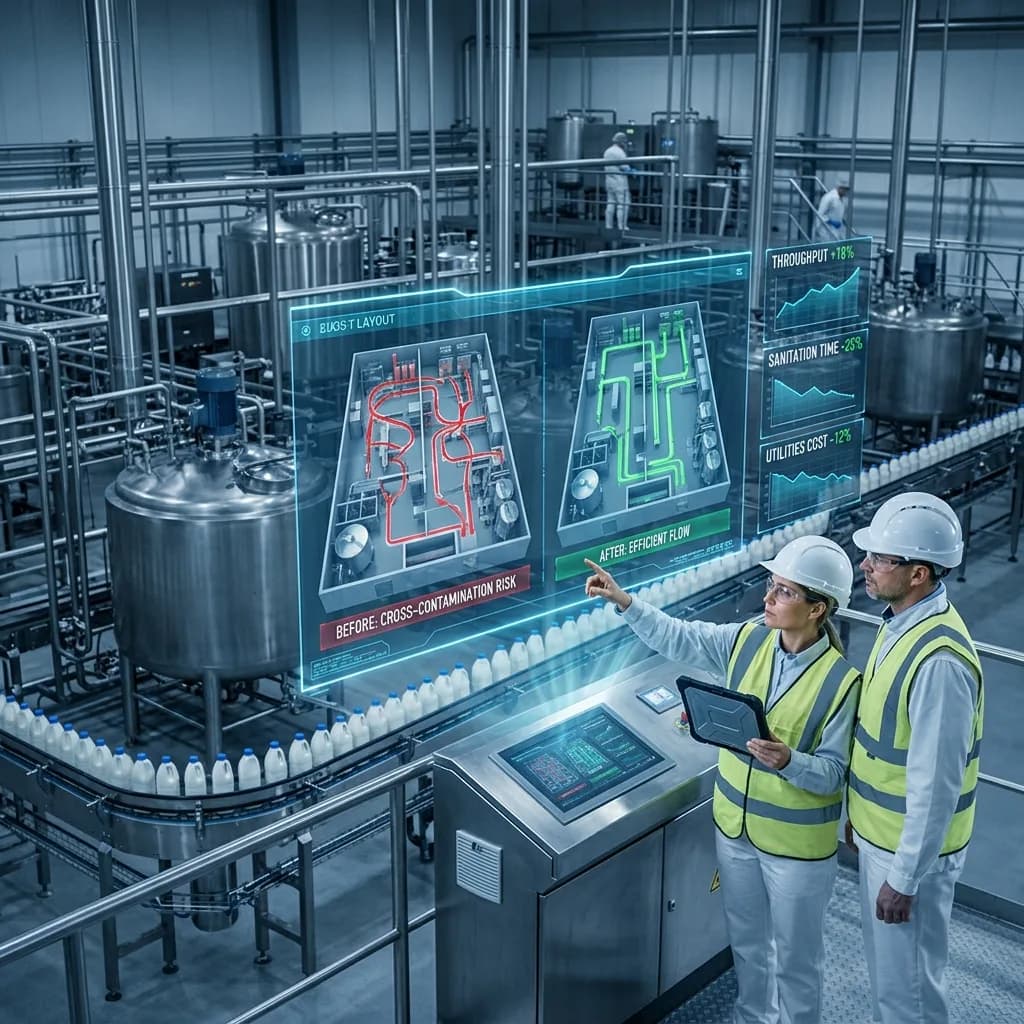
A PE firm acquires a $55M dairy processing facility running three product lines. Within 90 days of close, the operations team discovers that raw ingredient receiving, allergen-containing mix lines, and finished goods staging all share a single corridor. Cross-traffic causes 14 hours per week of production delays, forces two additional sanitation cycles daily, and creates an allergen cross-contact risk that the previous owner managed through heroic manual intervention. The layout reconfiguration to fix it: $2.8M. The EBITDA impact of not fixing it: $1.4M annually in lost throughput, excess labor, and audit risk. This is why plant layout matters to PE investors — and why understanding layout tradeoffs before close can save millions.
Why Plant Layout Is a Strategic Asset
Plant layout determines the physics of your operation. It dictates material flow distance, labor travel time, contamination risk vectors, cleaning efficiency, and expansion flexibility. A well-designed layout compounds value every shift. A poorly designed one compounds cost.
In food manufacturing specifically, layout carries regulatory weight that general manufacturing does not. FDA, USDA, and GFSI audit schemes all evaluate physical separation of raw and ready-to-eat zones, allergen isolation, and sanitary design. A layout that fails these criteria creates ongoing compliance cost — or worse, a recall event averaging $10M in direct costs for mid-market food companies.
The four dominant layout configurations in food manufacturing are linear (straight-line) flow, U-shaped flow, L-shaped flow, and cellular (pod) layouts. Each carries distinct advantages and limitations.
Linear (Straight-Line) Flow
Linear layout arranges processing steps sequentially from raw material receiving at one end to finished goods shipping at the other. Material moves in a single direction with no backtracking.
Advantages:
- Simplest regulatory compliance — raw-to-finished separation is inherent in the design
- Minimal cross-contamination risk with unidirectional flow
- Easy to understand, train, and audit
- Lowest changeover complexity for single-product runs
Disadvantages:
- Requires long, narrow building footprints — typically 3:1 or 4:1 length-to-width ratio
- Utility runs (steam, compressed air, refrigeration, CIP supply) must traverse the full building length, adding $150K–$400K in piping costs for facilities over 80,000 sq ft
- Poor labor utilization — operators at one end cannot assist at the other
- Expansion typically requires building extension in one direction, which may conflict with site constraints
Ideal use cases: Single-product facilities, USDA-inspected meat and poultry plants where unidirectional flow is effectively required, and new greenfield builds with sufficient lot depth.
Material flow distance (normalized): 1.0x baseline
U-Shaped Flow
U-shaped layout places receiving and shipping on the same side of the building, with processing flowing down one leg, across the back, and returning on the other leg. This is the most common layout in food manufacturing facilities built after 2000.
Advantages:
- Receiving and shipping share dock infrastructure, reducing construction costs by $200K–$500K
- Shorter utility runs — supply headers serve both legs from a central mechanical room
- Better labor flexibility — operators can move between adjacent process steps
- Compact footprint fits standard industrial building dimensions (1.5:1 ratio)
- Supports cross-training and visual management across the production floor
Disadvantages:
- The "turn" zones at the base of the U create potential cross-traffic between early-stage and late-stage product
- Requires careful zoning design to prevent raw and RTE product from sharing airspace at the curve
- Allergen isolation is more complex — parallel lines in opposite legs may share HVAC zones
- Changeover on one leg can affect the other if shared utilities are not properly valved
Ideal use cases: Multi-product facilities, plants running 2–4 SKU families, and brownfield retrofits in existing rectangular buildings.
Material flow distance (normalized): 0.70x–0.85x vs. linear
L-Shaped Flow
L-shaped layout places receiving on one face of the building and shipping on an adjacent face, with processing flowing through a 90-degree turn. This layout often results from building additions or site constraints rather than intentional design.
Advantages:
- Separates receiving and shipping traffic patterns, reducing truck congestion
- The corner zone provides a natural location for a central mechanical/utility room serving both wings
- Works well on corner lots or constrained sites where linear or U-shaped footprints do not fit
Disadvantages:
- The 90-degree turn creates a bottleneck zone where conveyors, piping, and personnel all compete for space
- Material handling at the turn typically requires powered conveyance (an additional $80K–$150K vs. gravity flow)
- Unequal wing lengths create scheduling imbalances — one wing finishes before the other
- Expansion options are limited to extending either wing, often requiring demolition of the corner utility room
Ideal use cases: Facilities built through phased additions, sites with road frontage on two sides, and operations where receiving and shipping volume asymmetry justifies separated docks.
Material flow distance (normalized): 0.80x–0.95x vs. linear
Cellular (Pod) Layout
Cellular layout organizes production into self-contained pods or cells, each handling a complete product family from raw processing through packaging. Shared infrastructure (warehousing, utilities, sanitation) serves all pods from a central spine.
Advantages:
- Best allergen isolation — each pod operates as an independent zone with dedicated HVAC and drainage
- Enables true parallel production of incompatible product families (e.g., dairy and plant-based in the same facility)
- Individual pods can be shut down for deep cleaning, maintenance, or changeover without affecting others
- Highly scalable — new pods can be added modularly
- Best OEE performance for high-mix operations (typically 5–12 percentage points above U-shaped in facilities running 8+ SKU families)
Disadvantages:
- Highest construction cost — duplicated utility connections, HVAC zones, and drainage systems add 20–35% to mechanical costs vs. U-shaped
- More total square footage required for equivalent throughput (typically 15–25% more)
- Requires sophisticated scheduling software to optimize pod utilization
- Shared resources (warehousing, QA lab, sanitation chemical storage) create internal logistics complexity
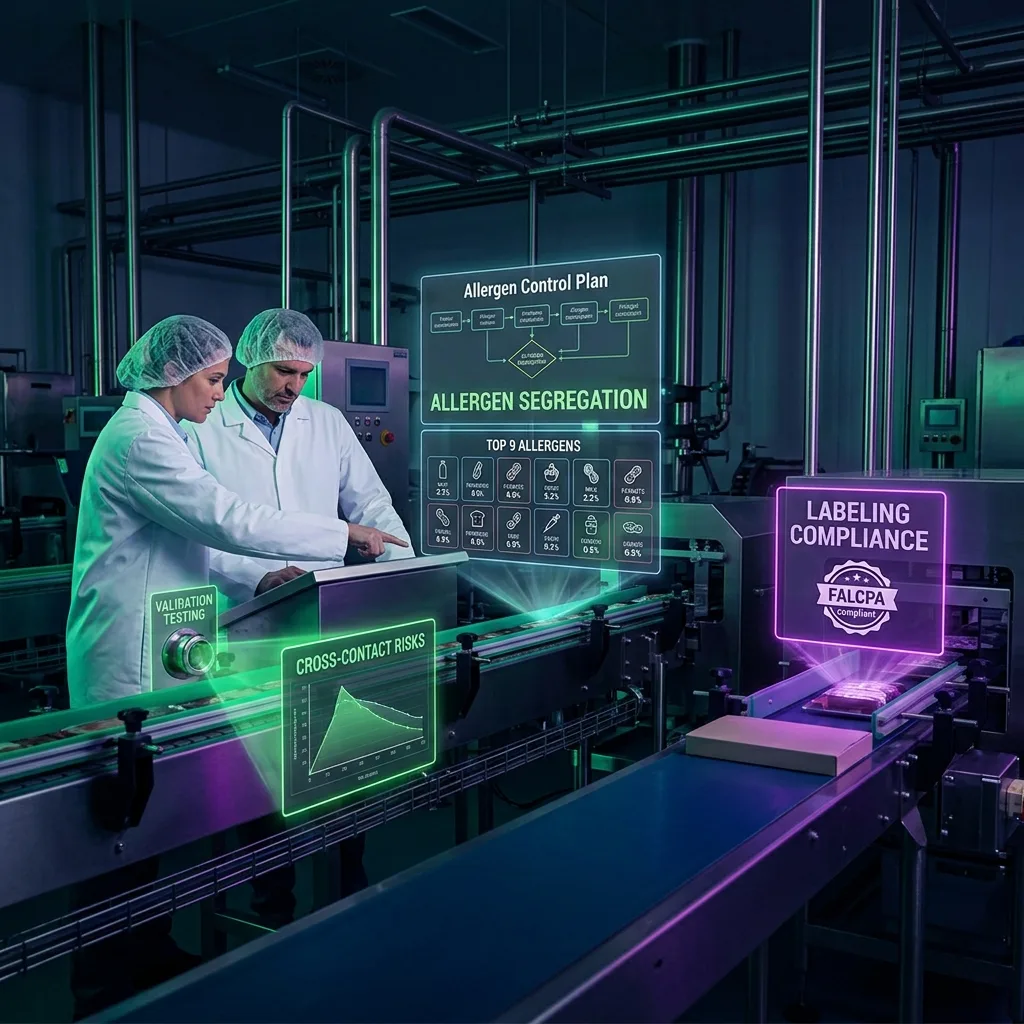
Ideal use cases: Co-manufacturing and co-packing operations, allergen-intensive facilities (Top 9 allergen management), plants producing both conventional and organic/clean-label products, and facilities where future product diversification is part of the investment thesis.
Material flow distance (normalized): 0.50x–0.70x vs. linear (within each pod)
Layout Comparison Matrix
| Criteria | Linear | U-Shaped | L-Shaped | Cellular |
|---|---|---|---|---|
| Regulatory compliance ease | 9/10 | 7/10 | 6/10 | 9/10 |
| Allergen isolation capability | 7/10 | 5/10 | 6/10 | 10/10 |
| Space efficiency (throughput/sq ft) | 6/10 | 8/10 | 6/10 | 5/10 |
| Labor utilization | 5/10 | 8/10 | 6/10 | 7/10 |
| Changeover speed | 6/10 | 7/10 | 5/10 | 9/10 |
| Cleaning/sanitation efficiency | 8/10 | 7/10 | 5/10 | 9/10 |
| Expansion flexibility | 4/10 | 7/10 | 5/10 | 9/10 |
| Construction cost (lower = better) | 8/10 | 7/10 | 6/10 | 4/10 |
| Weighted Average (equal weights) | 6.6 | 7.0 | 5.6 | 7.8 |
How Layout Drives OEE, Labor, and Cleaning Metrics
Layout choice directly affects the three KPIs PE firms care about most in food manufacturing: OEE, labor cost per unit, and sanitation time.
OEE impact: In a study of 38 food manufacturing facilities, plants with optimized U-shaped layouts averaged 72% OEE versus 64% OEE for legacy linear plants of similar age and product complexity. Cellular layouts in high-mix environments achieved 76% OEE on average — driven primarily by reduced changeover time (the availability component of OEE).
Labor productivity: U-shaped layouts reduce operator travel distance by 15–30% compared to linear, translating to $180K–$350K in annual labor savings for a 200-employee facility. Cellular layouts further reduce travel within each pod but may require additional material handling labor for inter-pod transfers.
Cleaning efficiency: Linear layouts allow straightforward CIP circuit design but require long pipe runs. U-shaped layouts reduce CIP pipe length by 20–35%, cutting chemical and water costs by $40K–$80K annually in facilities processing 50M+ lbs/year. Cellular layouts enable zone-specific cleaning without full plant shutdown, recovering 8–15 production hours per week in high-changeover environments.
| Metric | Linear | U-Shaped | Cellular |
|---|---|---|---|
| Average OEE (high-mix facility) | 64% | 72% | 76% |
| Annual labor savings vs. linear | Baseline | $180K–$350K | $120K–$280K |
| CIP water/chemical reduction vs. linear | Baseline | 20–35% | 15–25% per pod |
| Weekly production hours recovered from cleaning | Baseline | 3–6 hrs | 8–15 hrs |
| Changeover time (4-SKU rotation) | 45–60 min | 30–45 min | 15–25 min |
PE Due Diligence: Evaluating Plant Layout
During operational DD, layout assessment should be a first-day priority. Here is what to evaluate and what constitutes a red flag.
What to look for:
- Request the facility's process flow diagram (PFD) and overlay it on the building floor plan. Do material flow arrows cross? Every crossing point is a contamination risk and a throughput bottleneck.
- Walk the raw-to-finished product path with a stopwatch. In an optimized facility, material transit time should be under 8% of total process cycle time. Above 15% signals layout inefficiency.
- Check utility routing. Are steam, compressed air, and refrigerant lines running excessive distances? Every 100 feet of unnecessary steam piping loses $3,500–$6,000 annually in energy costs.
- Count the number of powered conveyance points (elevators, lifts, powered turns). Each one represents $15K–$25K in annual maintenance cost and a potential single point of failure.
Red flags:
- Finished product and raw material sharing any corridor, doorway, or dock
- More than two 90-degree material flow direction changes
- Sanitation chemical storage located more than 200 feet from the farthest cleaning station
- No physical barrier (wall, air curtain, or positive pressure differential) between raw and RTE zones
- Building additions that created dead-end zones or required product backtracking
Capital cost of layout reconfiguration:
| Scope | Typical Cost | Timeline | EBITDA Payback |
|---|---|---|---|
| Minor flow optimization (conveyors, doorways) | $150K–$400K | 2–4 months | 6–12 months |
| Zone separation (walls, HVAC, drainage) | $500K–$1.5M | 4–8 months | 12–24 months |
| Major layout reconfiguration | $2M–$6M | 8–18 months | 18–36 months |
| Full plant re-layout (production relocation) | $5M–$15M | 12–24 months | 24–48 months |
Translating Layout Optimization Into EBITDA
For PE investors, the layout conversation is ultimately about EBITDA. A mid-market food manufacturer generating $8M–$15M EBITDA typically leaves $800K–$2.2M on the table annually due to suboptimal plant layout. That value leaks through excess labor travel, extended changeovers, redundant sanitation cycles, and throughput constraints at bottleneck zones.
The math is straightforward. A $55M revenue facility running a legacy linear layout at 64% OEE that converts to an optimized U-shaped layout at 72% OEE unlocks 8 percentage points of capacity. At 70% gross margin, that capacity is worth $3.1M in annual gross profit. Subtract $1.2M for the layout project (annualized over a 3-year hold) and $400K in incremental variable cost, and the net EBITDA improvement is $1.5M per year — a 10–19% EBITDA lift that flows directly to exit valuation at a 10–12x multiple.
Plant layout is not an engineering curiosity. It is a value creation lever that PE firms should evaluate during DD, fund during the first 12 months of ownership, and harvest at exit. The firms that treat layout as a strategic asset — not a facilities issue — consistently outperform on food manufacturing platform investments.