Two food manufacturers provide identical products at identical prices. Customer A receives order in 2 days; Customer B receives order in 5 days. Customer A gets responses to questions within 24 hours; Customer B takes 3 days.
Customer A renews their contract. Customer B switches to competitor.
Service excellence—turning operations into customer-facing advantage—drives customer loyalty and premium pricing.
The Service Delivery Components
Order Fulfillment:
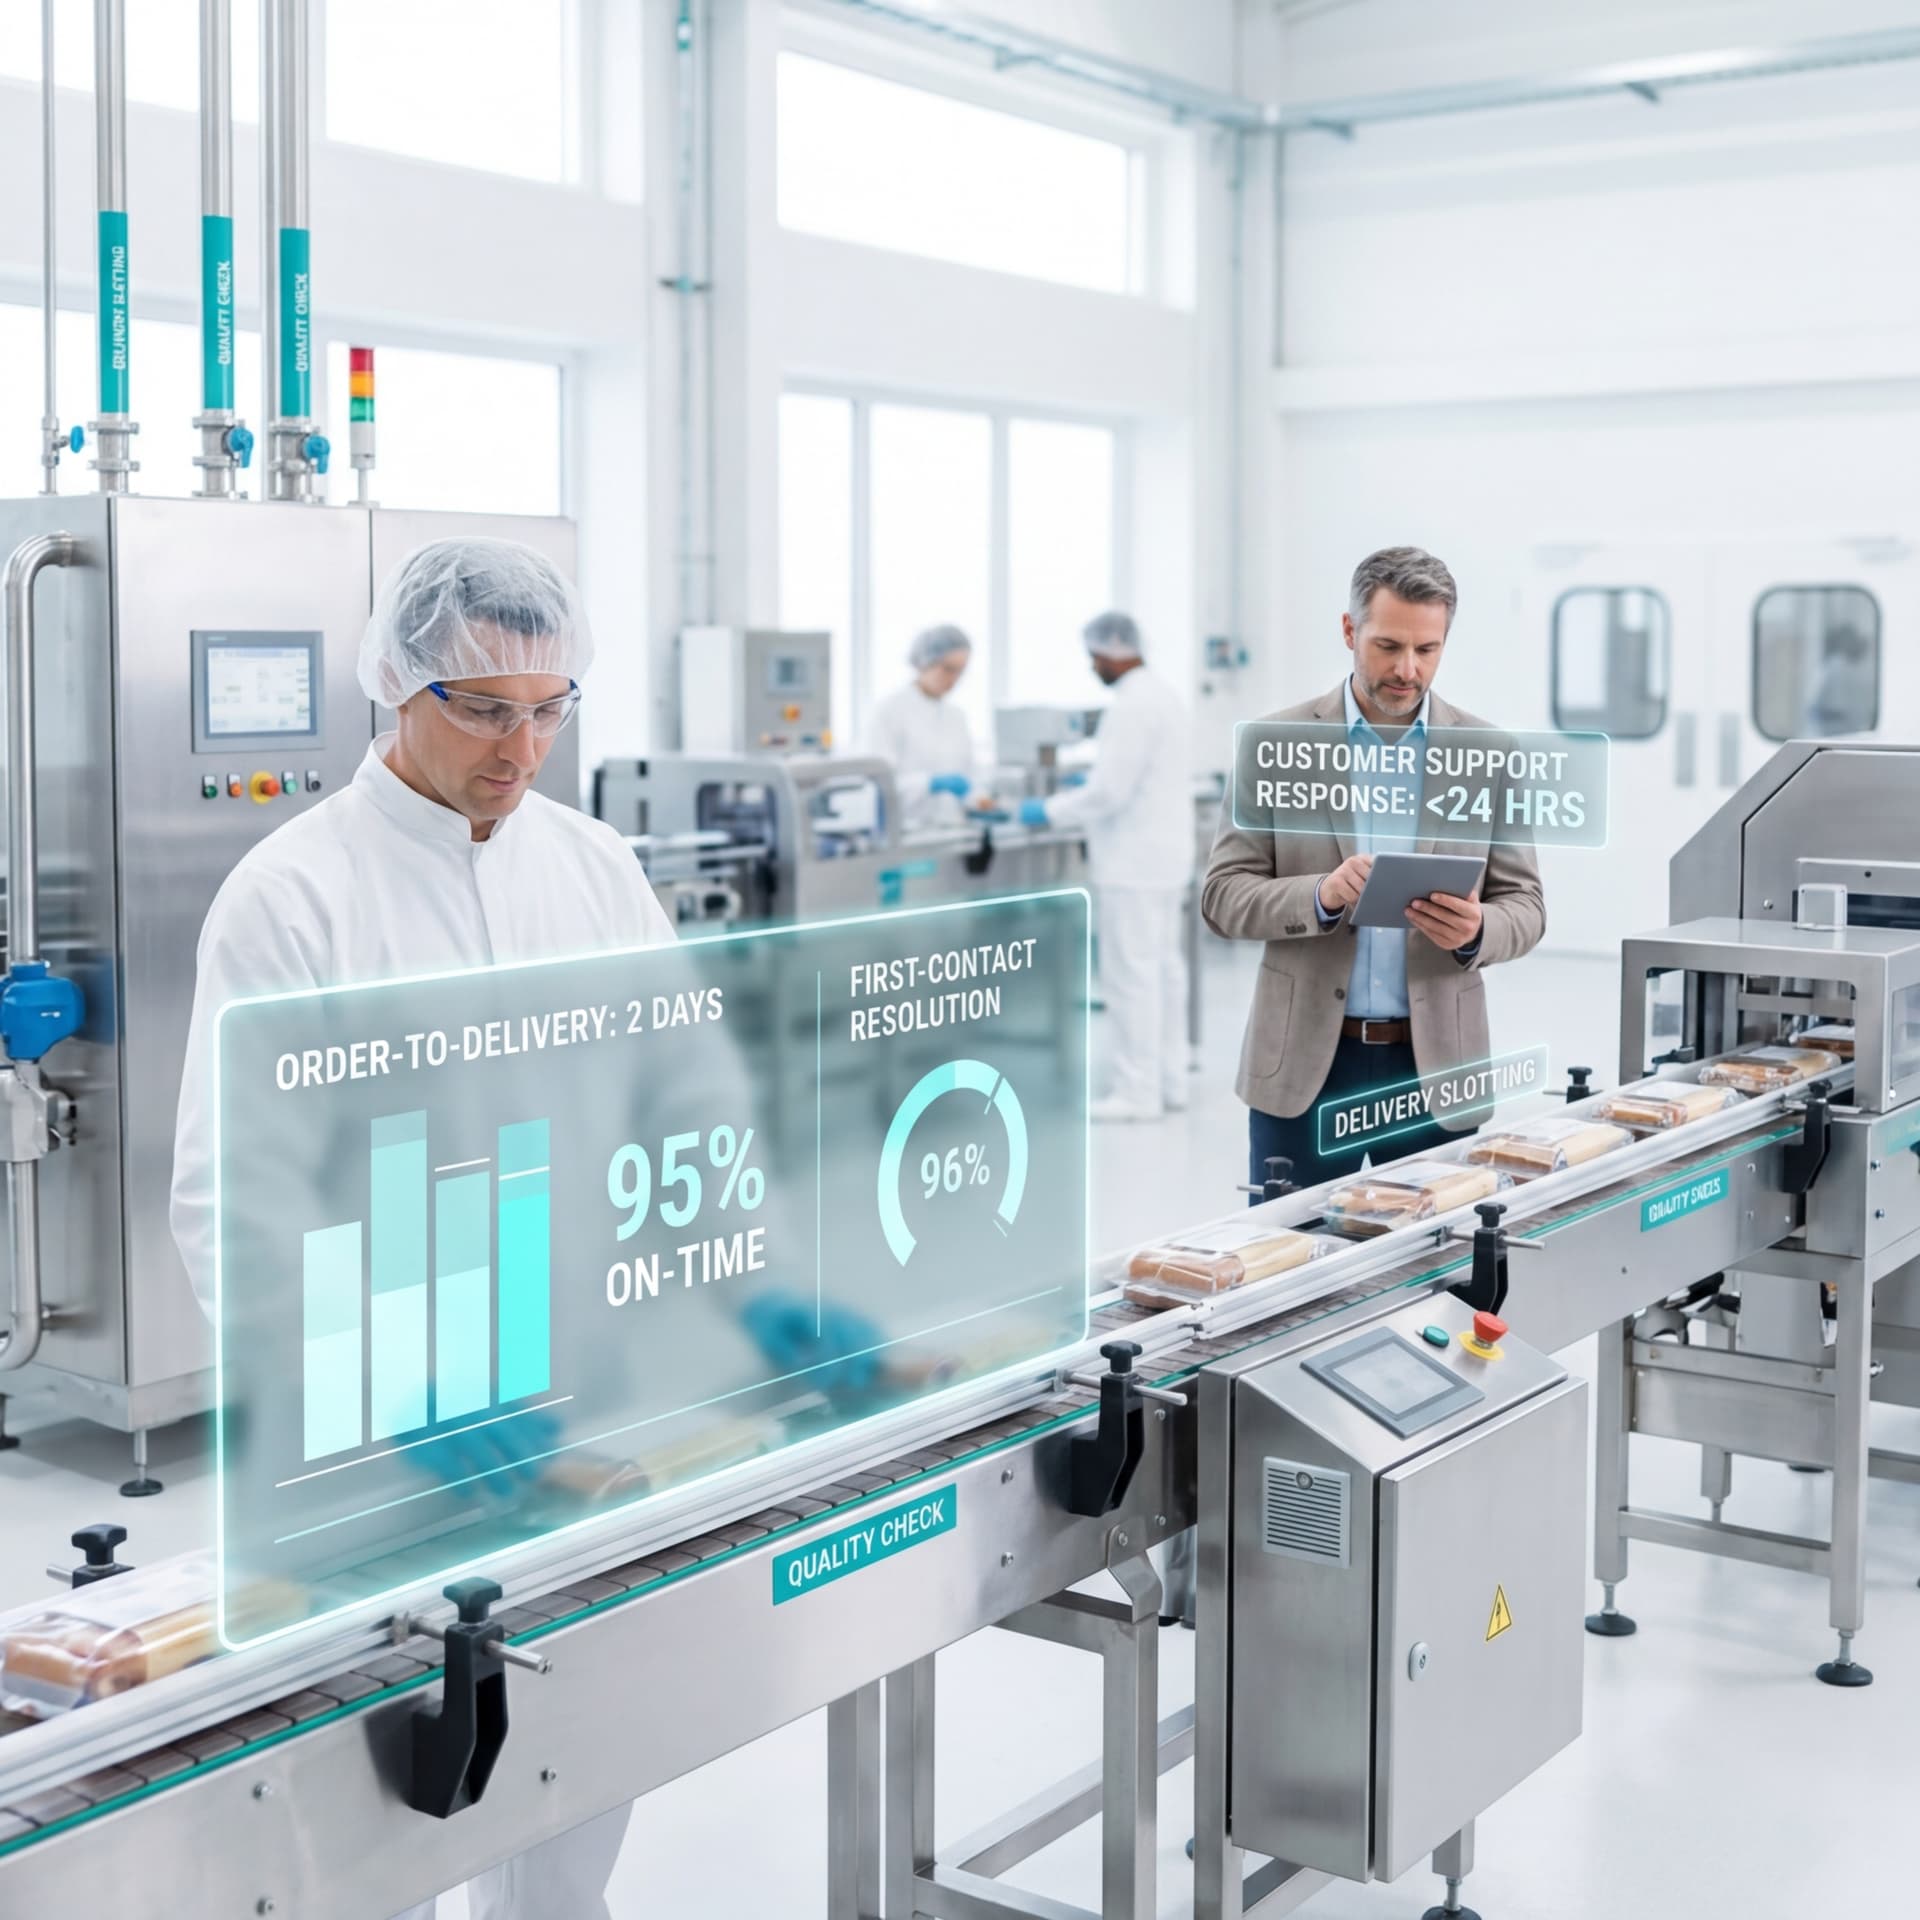
- Target: 95%+ on-time delivery
- Measurement: Days from order to delivery
- Service level: Guaranteed delivery window (e.g., "within 2 days of order")
- Advantage: Customer can rely on supply consistency
Customer Support:
- Target: 24-hour response to customer inquiries
- Measurement: Response time to emails, calls, messages
- Service level: Escalation path for urgent issues
- Advantage: Customers feel supported and valued
Problem Resolution:
- Target: 95%+ resolution on first contact
- Measurement: Root cause analysis, corrective action implementation
- Service level: Dedicated account manager for quality issues
- Advantage: Trust and confidence in supplier reliability
Information Transparency:
- Measurement: Real-time visibility into order status
- Service level: Online portal showing production, shipping, delivery status
- Advantage: Customer confidence and reduced uncertainty
Customization and Flexibility:
- Measurement: Ability to accommodate special orders, custom sizing, delivery timing
- Service level: Dedicated resources for high-value customers
- Advantage: Differentiation through partnership approach
Building Service Excellence Infrastructure
Investment Required:
- Customer service team: 1 person per 50 active customers ($50-60K salary)
- Systems (CRM, order tracking, quality management): $50K-100K annually
- Training and process development: $20-30K annually
For 500 active customers:
- Customer service team: 10 people = $500-600K
- Systems: $75K annually
- Training: $25K annually
- Total: $600-700K annually
Revenue Impact:
- 500 customers x $50K average annual revenue = $25M
- Service excellence enables: 10-15% price premium + 20-30% improvement in retention
- Revenue impact: $2.5-3.75M from premium positioning + $1.5-2.25M from retention improvement
- Total: $4-6M additional revenue
- Additional EBITDA at 35% margin: $1.4-2.1M
ROI: Service investment of $700K generates $1.4-2.1M EBITDA = 2-3x return
Service Excellence Metrics
Track and report:
| Metric | Target | Benchmark |
|---|---|---|
| On-Time Delivery Rate | 95%+ | 90-95% industry |
| Customer Response Time | Under 24 hours | 24-48 hours industry |
| First-Contact Resolution | 95%+ | 80-90% industry |
| Customer Satisfaction (NPS) | 50+ | 35-45 industry |
| Customer Retention Rate | 80%+ | 60-70% industry |
Competitive Differentiation
In commoditized markets, service excellence becomes primary differentiation:
- Quality similar across competitors
- Price competitive pressure
- Service excellence = defensible advantage
A manufacturer with 95% on-time delivery vs. competitors at 85% creates customer confidence worth 5-10% price premium.
For food manufacturing companies, investing in customer service infrastructure and systems excellence creates defensible competitive advantage enabling premium pricing and improved retention.